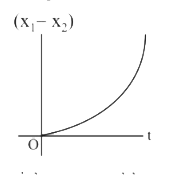
A
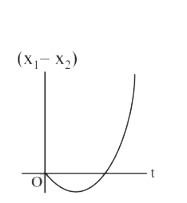
B
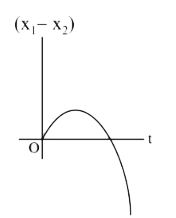
C
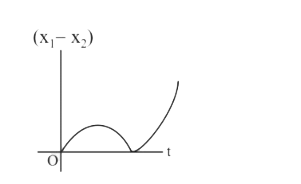
D
Text Solution
Verified by Experts
The correct Answer is:


Recommended Questions
- A body is at rest at x =0 . At t = 0, it starts moving in the posi...
Text Solution
|
- A body is at rest at x =0 . At t = 0, it starts moving in the posi...
Text Solution
|
- A body A moves with a uniform acceleration a and zero initial velocity...
Text Solution
|
- The dependence of the acceleration of a body with time is shown in Fig...
Text Solution
|
- कोई पिण्ड x=0 पर विराम में है t=0 पर यह धनात्मक X-दिशा में नियत त्वरण ...
Text Solution
|
- एक वस्तु समय t = 0 पर विराम में है। वह X - अक्ष की धन दिशा में एक नियम...
Text Solution
|
- मान लीजिए जब कमानी अतानित अवस्था में है , तब पिंड की स्थिति x=0 है त...
Text Solution
|
- मान लीजिए जब कमानी अतानित अवस्था में है , तब पिंड की स्थिति x=0 है त...
Text Solution
|
- A body starting from rest at t = 0 moves along a straight line with a ...
Text Solution
|