A
B
C
D
Text Solution
Verified by Experts
The correct Answer is:


Similar Questions
Explore conceptually related problems
Recommended Questions
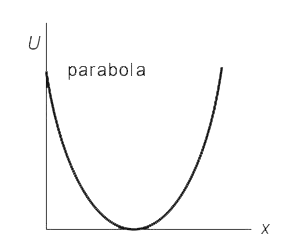
- The first graph shows the potential energy U(x) for a particle moving...
Text Solution
|
- Figure shows the displacement time graph of a particle moving on the X...
Text Solution
|
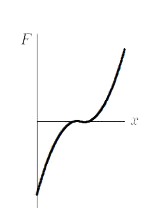
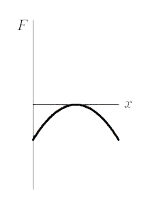
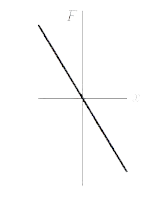
- Potential Energy U(x) and associated force F(x) bears the relation F(x...
Text Solution
|
- A single conservative force F(x) acts on a particle that moves along t...
Text Solution
|
- The velocity-time graph for a particle moving along X-axis is shown in...
Text Solution
|
- A single conservative force F(x) acts on particle that moves along the...
Text Solution
|
- The velocity time graph for a particle moving along x-axis is shown in...
Text Solution
|
- Figure shows the position-time graph of a particle moving on the X--ax...
Text Solution
|
- The first graph shows the potential energy U(x) for a particle moving...
Text Solution
|