A
B
C
D
Text Solution
Verified by Experts
The correct Answer is:


Recommended Questions
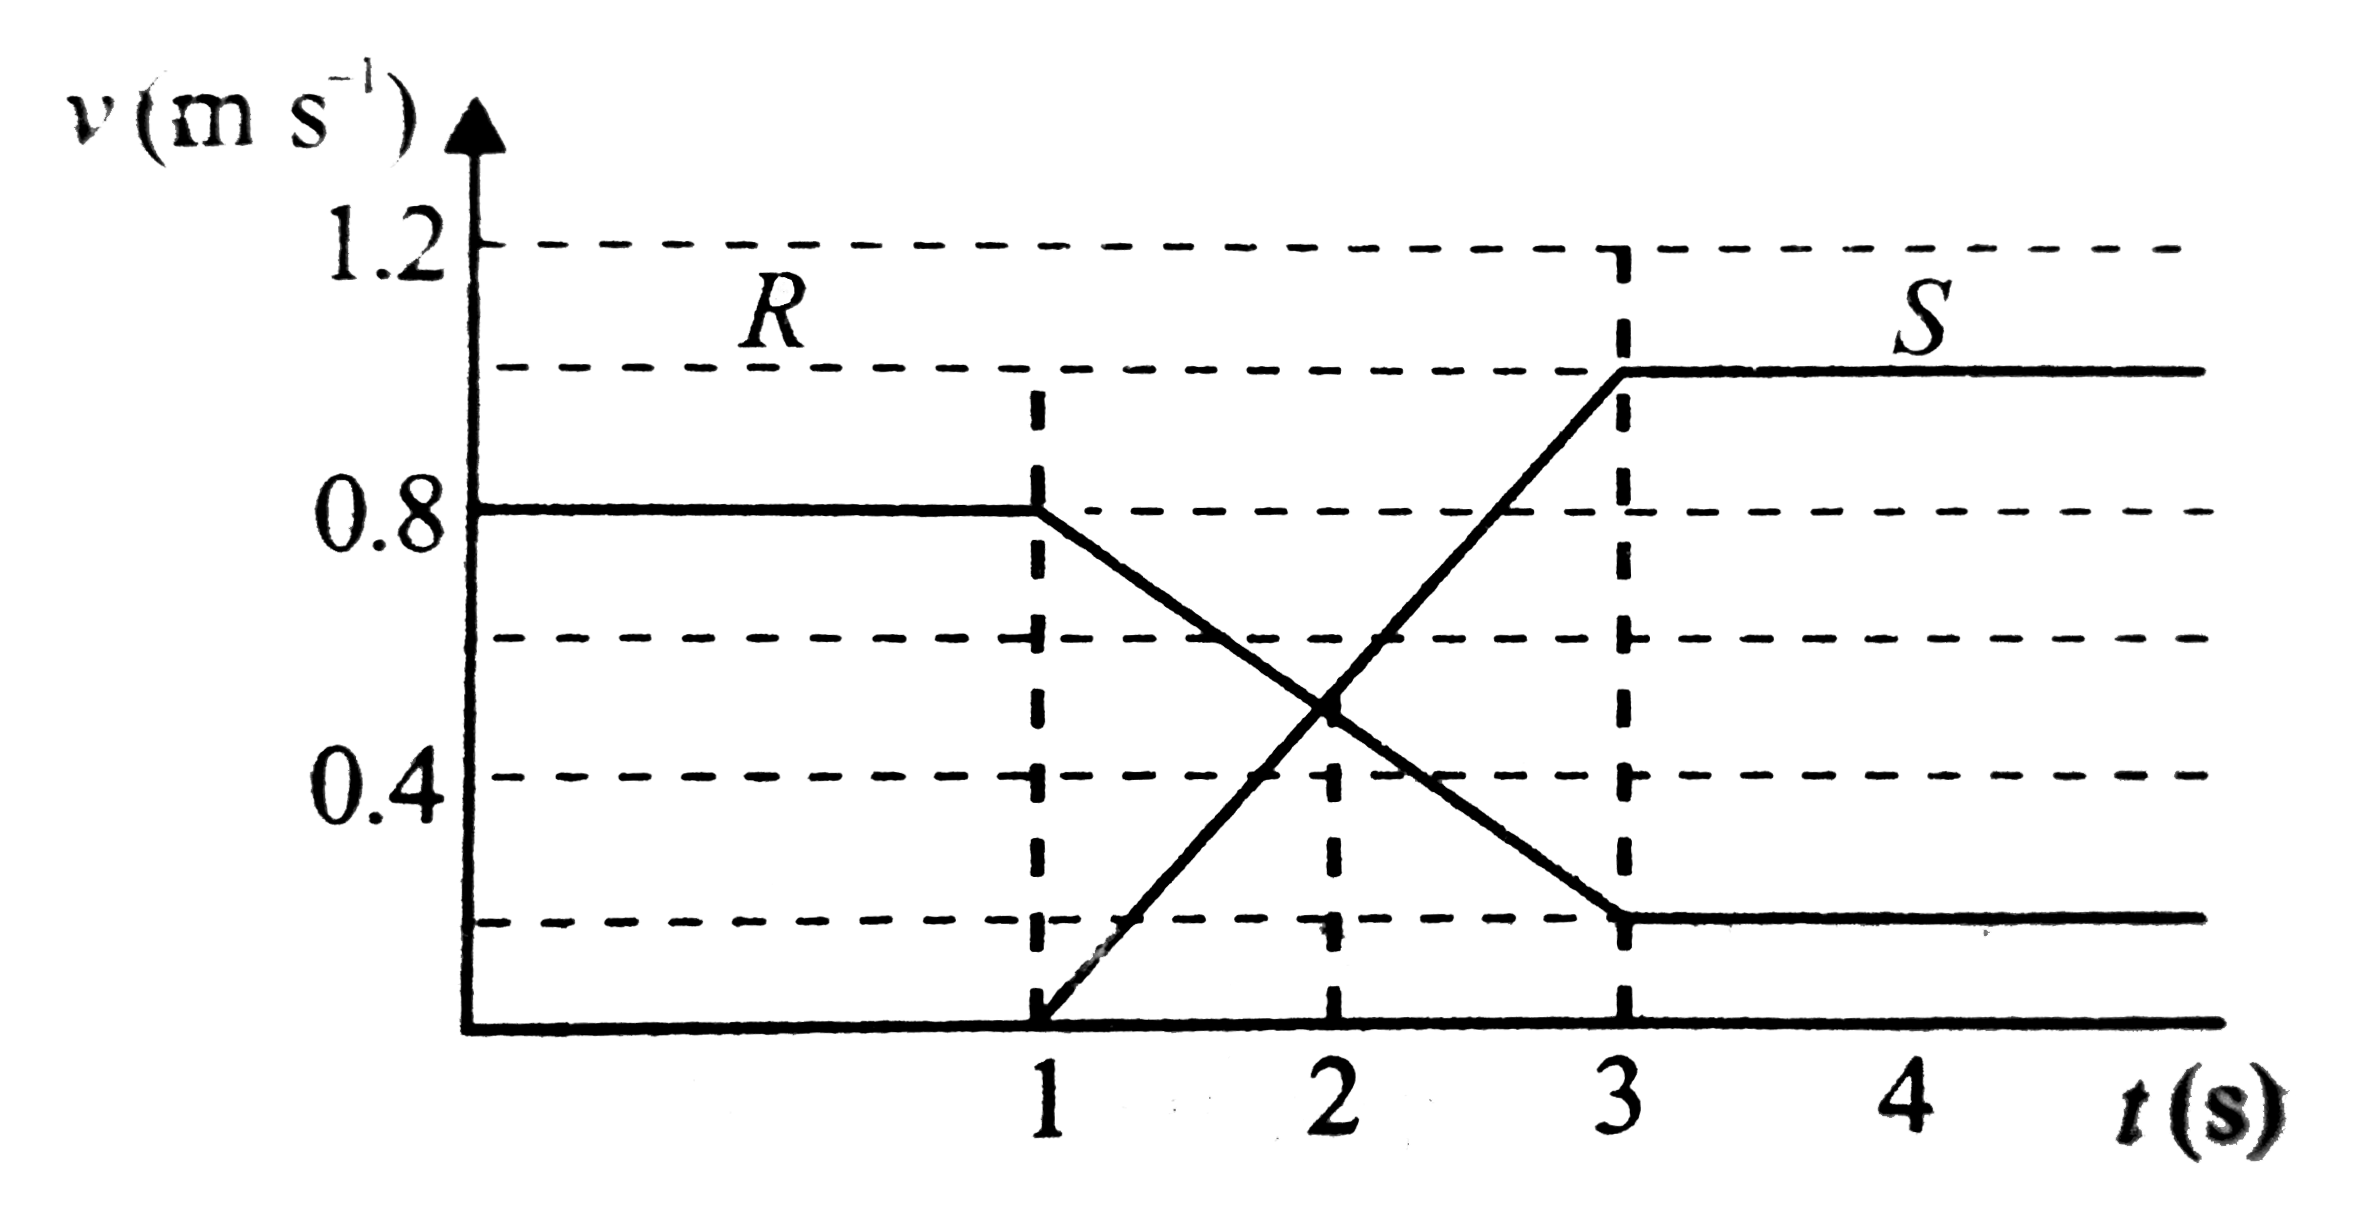
- Figure shows the velocity-time graph for two masses R and S that colli...
Text Solution
|
- Figure shows the velocity-time graph for two masses R and S that colli...
Text Solution
|
- Two perfectly elastic particles A and B of equal masses travelling alo...
Text Solution
|
- The diagram to the right shows the velocity-time graph for two masses ...
Text Solution
|
- The diagram shows the velocity - time graph for two masses R and S tha...
Text Solution
|
- Two particles of equal mass moving towards each other with velocities ...
Text Solution
|
- Two balls of equal masses movin with velocities 10m/s and -7m/s respec...
Text Solution
|
- Putty balls of two equal mass cling to each other after a collision, m...
Text Solution
|
- A steel sphere of mass 100 gm moving with a velocity of 4m/s collides ...
Text Solution
|