A
B
C
D
Text Solution
Verified by Experts
The correct Answer is:


Recommended Questions
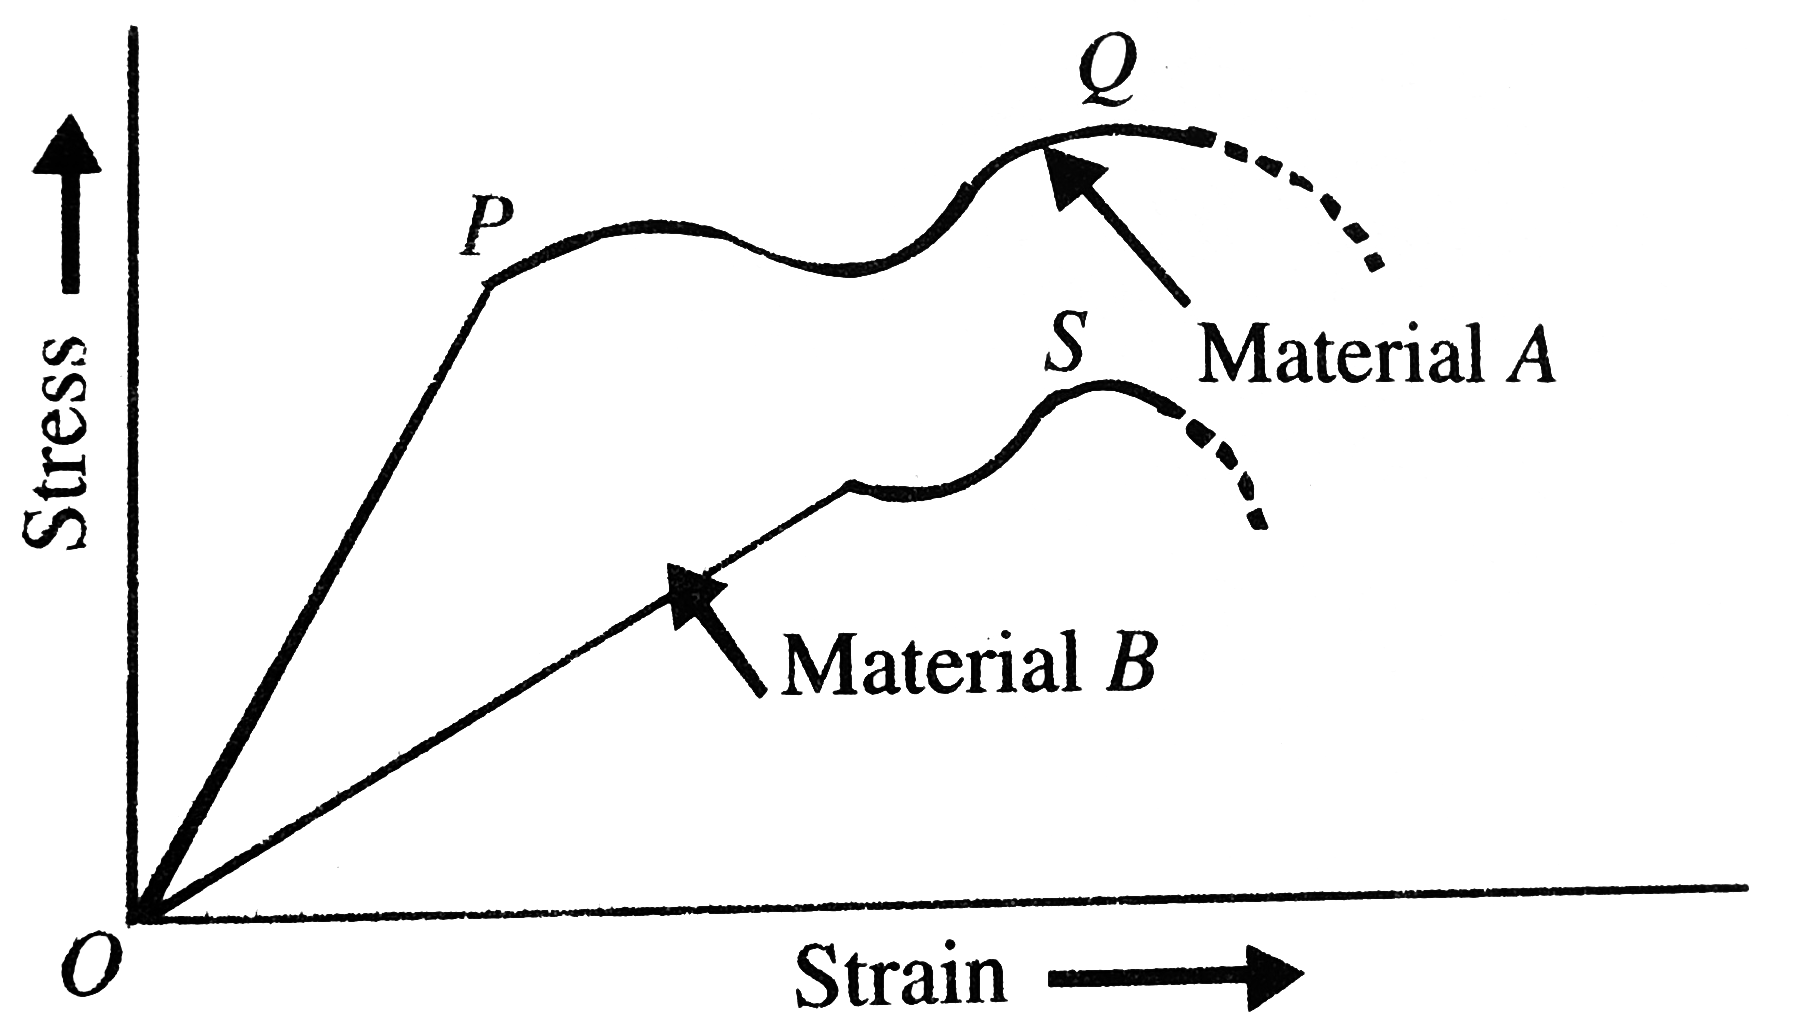
- Figure shows the stress-strain graphs for materials .A and B. From the...
Text Solution
|
- Figure shows the stress-strain graphs for materials . A and B . From t...
Text Solution
|
- The stress versus strain graphs for wires of two materials A and B are...
Text Solution
|
- The stress- strain graphs for materials A and B are as shown. Choose t...
Text Solution
|
- The stress versus strain graphs for wires of two materials A and B are...
Text Solution
|
- The stress-strain graphs for two materials A and are shown in figure. ...
Text Solution
|
- The stress-strain graphs for two materials are shown in figure. (Assum...
Text Solution
|
- The stress-strain graphs for two materials are as shown.
Text Solution
|
- The stress versus strain graphs for wires of two materials A and B are...
Text Solution
|