
Text Solution
Verified by Experts


Similar Questions
Explore conceptually related problems
Recommended Questions
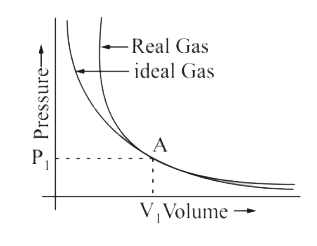
- Pressure versus volume graph for real gas and are shown in figure. Ans...
Text Solution
|
- The pressure of real gas is less than the pressure of an ideal gas bec...
Text Solution
|
- Under which of the following sets of conditions is a real gas expected...
Text Solution
|
- Pressure versus volume graph for real gas and are shown in figure. Ans...
Text Solution
|
- Statement-1 : At low pressure and high temperature real gas approaches...
Text Solution
|
- The pressure of real gas is less than the pressure of an ideal gas bec...
Text Solution
|
- A: A real gas will approach ideal behaviour at high temperature and lo...
Text Solution
|
- The pressure of real gas is less than the pressure of an ideal gas bec...
Text Solution
|
- Why at low pressures, the real gas behaves as ideal gas?
Text Solution
|