A
B
C
D
Text Solution
Verified by Experts
The correct Answer is:


Similar Questions
Explore conceptually related problems
Recommended Questions
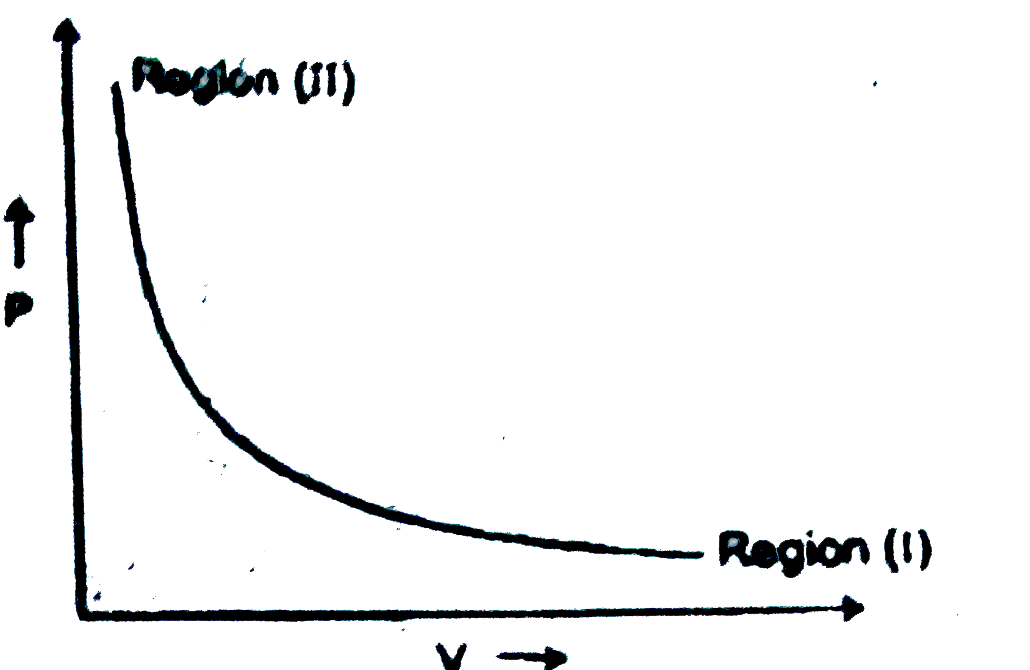
- Following graph represents a pressure (P) volume (V) relationship at a...
Text Solution
|
- Following graph represents a pressure (P) volume (V) relationship at a...
Text Solution
|
- Which of following graphs correctly represent variation of alpha = (-(...
Text Solution
|
- One of the important approach of the study of real gases involves the ...
Text Solution
|
- Which one of the following relationships when graphed does not give a ...
Text Solution
|
- For the given graph which of the following is correct : (n = mole of g...
Text Solution
|
- One of the important approach to the study of real gases involves the ...
Text Solution
|
- आयतन (V) तथा ताप (T) के बीच खींचे गये निम्नलिखित ग्राफो में कौन-सा ग्र...
Text Solution
|
- निम्न में से कौन - सा आयतन (V), ताप (T) ग्राफ ( आलेख ) , एक वायुमंडल...
Text Solution
|