A
B
C
D
Text Solution
Verified by Experts
The correct Answer is:


Similar Questions
Explore conceptually related problems
Recommended Questions
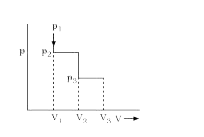
- The following diagram represents the (p-V) changes of gas. Thus, total...
Text Solution
|
- P - V diagram of an ideal gas is as shown in figure. Work done by the ...
Text Solution
|
- An ideal gas underoges cyclic process of ABCDA as shown in Given P-V d...
Text Solution
|
- An ideal monoatomic gas is taken the cycle ABCDA as shown in following...
Text Solution
|
- An ideal gas undergoes cyclic process ABCDA as shown in givend p-V dia...
Text Solution
|
- An ideal gas is taken around the cycle ABCA as shown in the P-V diagra...
Text Solution
|
- The following diagram represents the (p-V) changes of gas. Thus, total...
Text Solution
|
- A fixed mass of gas undergoes the cycle of changes represented by PQRS...
Text Solution
|
- P – V graph of an ideal gas is as shown in the diagram . Work done by ...
Text Solution
|