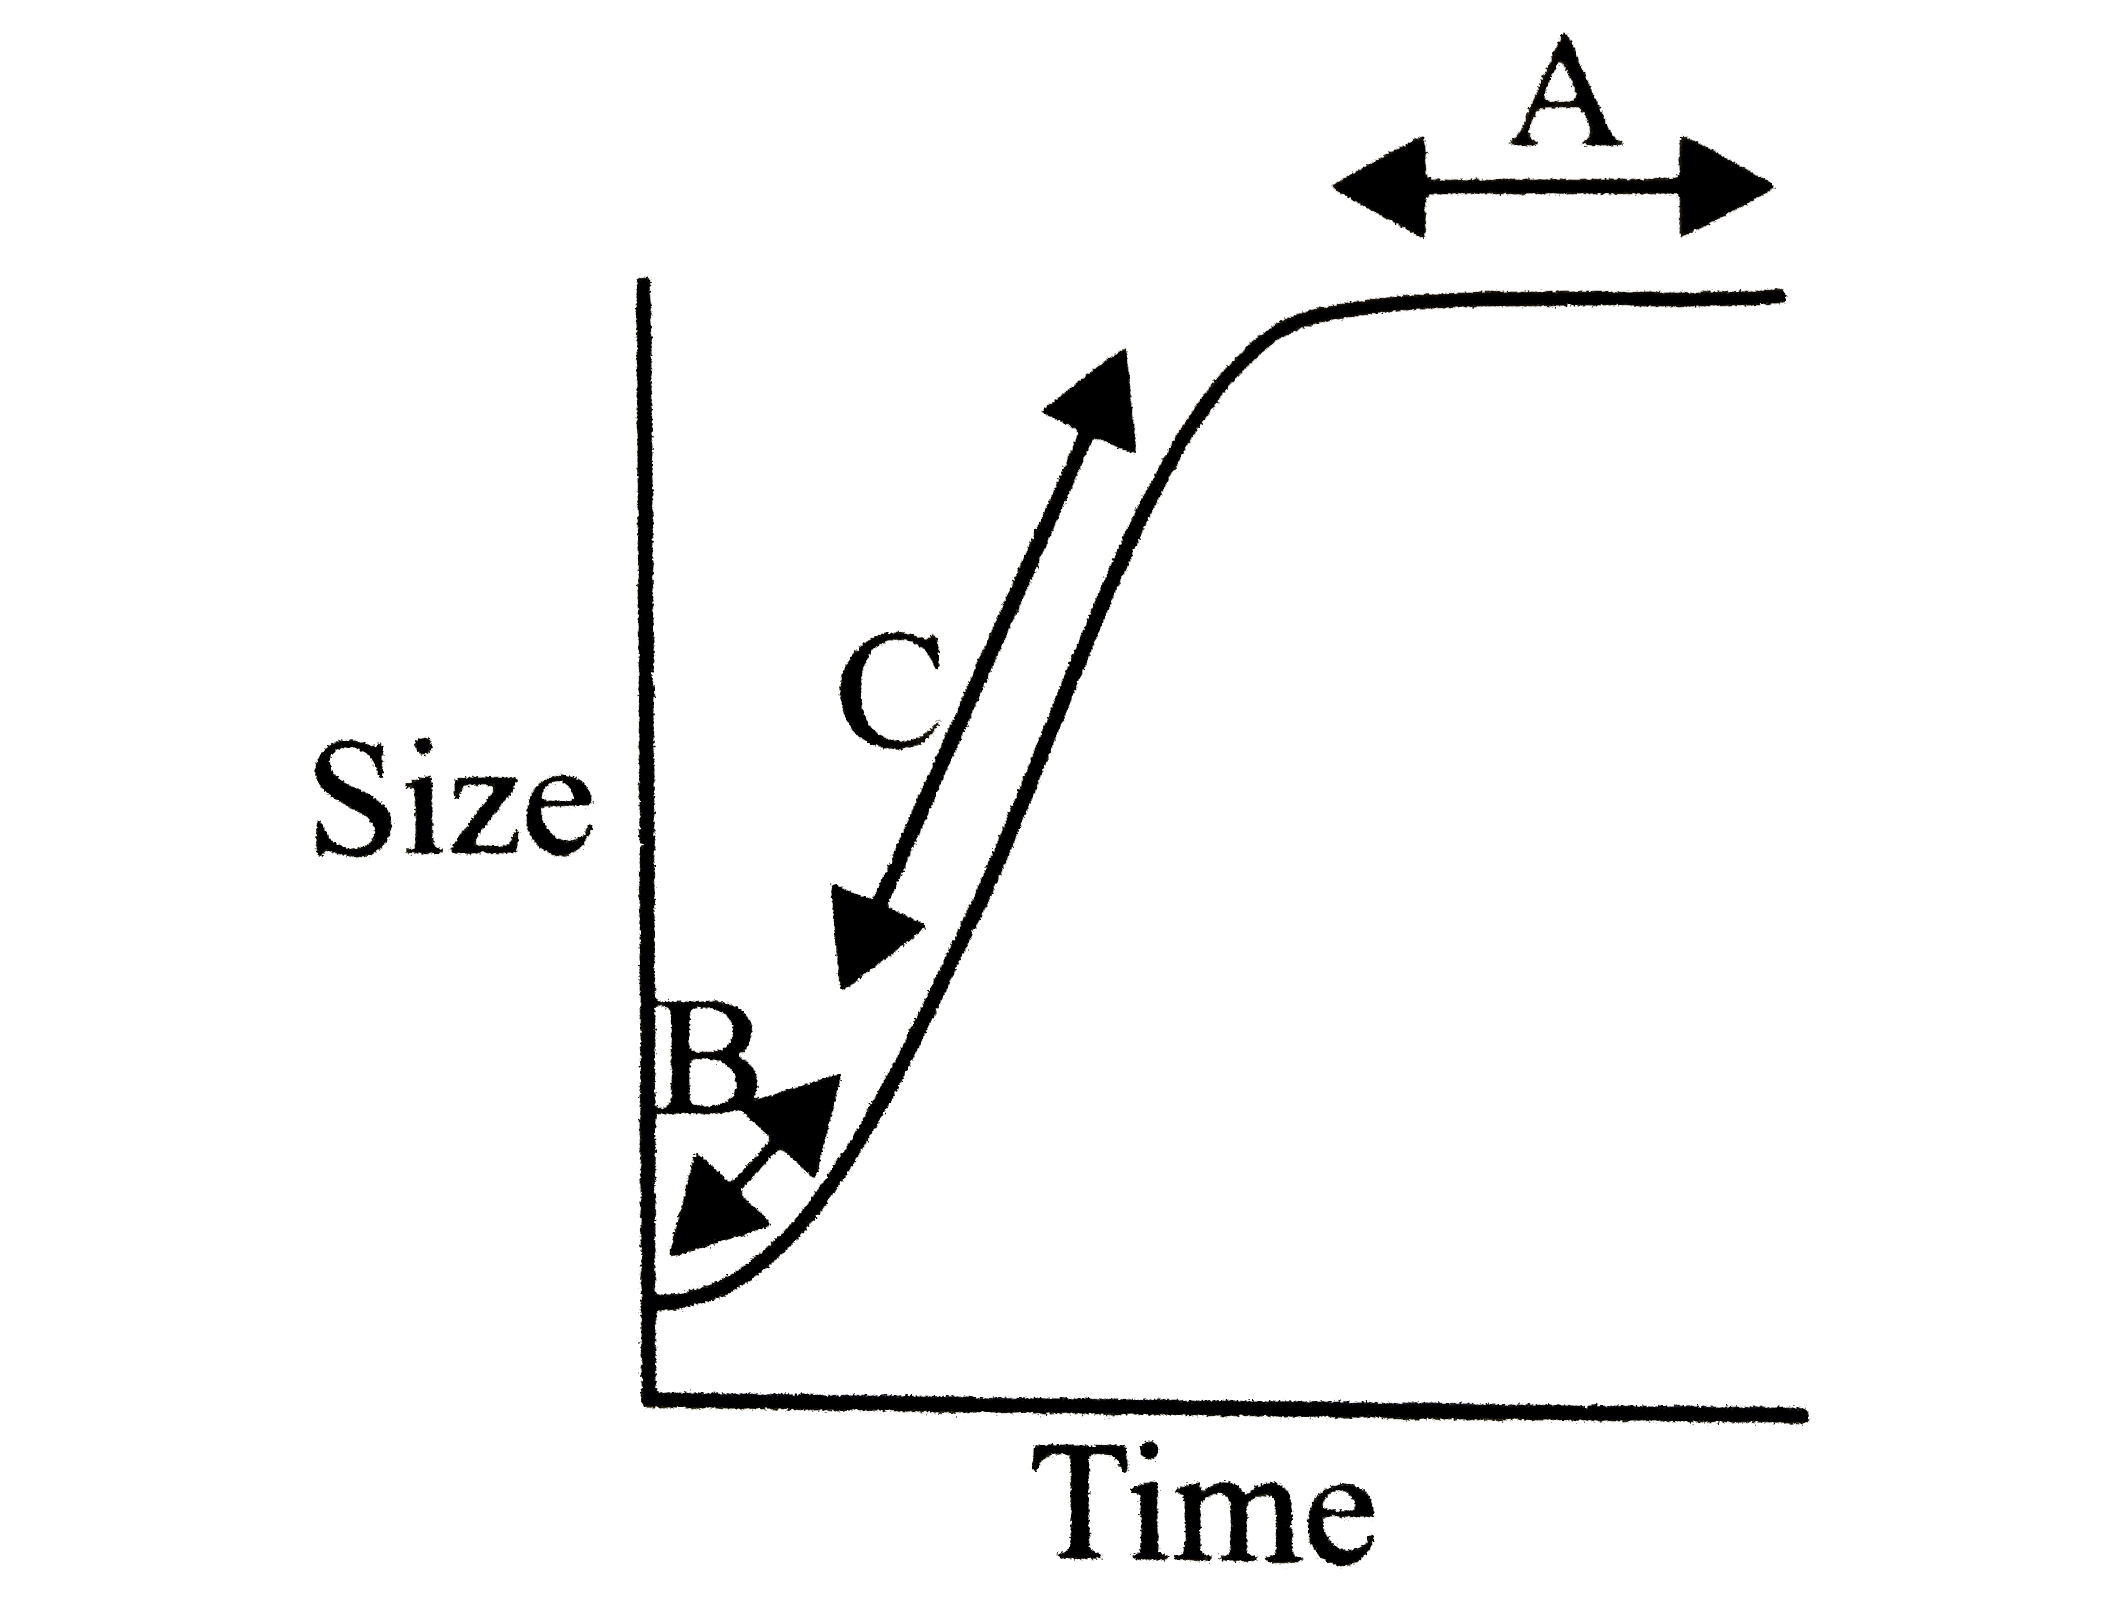
A
B
C
D
Text Solution
Verified by Experts
The correct Answer is:


Topper's Solved these Questions
Plant Growth and Movements
DINESH PUBLICATION|Exercise CYG|14 VideosPlant Growth and Movements
DINESH PUBLICATION|Exercise BRAIN TEASERS-IV|41 VideosPlant Growth and Movements
DINESH PUBLICATION|Exercise BRAIN TEASERS-IV|41 VideosPLANT BREEDING AND DISEASE CONTROL
DINESH PUBLICATION|Exercise MCQ|244 VideosPLATYHELMINTHES-THE FLAT WORMS
DINESH PUBLICATION|Exercise check your grasp|9 Videos
Similar Questions
Explore conceptually related problems
DINESH PUBLICATION-Plant Growth and Movements-RQ
- Plants requiring exposure to light for less than the critical photoper...
Text Solution
|
- Period between formative phase and maturation phase of plant growth is
Text Solution
|
- Given graph is drawn on the parameters of growth versus time. Here A,B...
Text Solution
|
- Match the columns : {:("Column I","Column II"),("1 Human urine","a C...
Text Solution
|
- The natural plant hormone isolated from cormn kernels and coconut milk...
Text Solution
|
- 6- furfuryl ammino purine 2, 4- dichorophenoxy acetic acid and indole ...
Text Solution
|
- Which type of movement is shown by Tulip and Sunflower respectively ?
Text Solution
|
- Which ones are long day plants
Text Solution
|
- Auxin develops at the tip of the stem. Its movement is largely
Text Solution
|
- Maximum growth rate occur in
Text Solution
|
- Apical dominance in higher plants is due to
Text Solution
|
- Induction of cell division activity and delay in senescence is caused ...
Text Solution
|
- Beta vulgaris is
Text Solution
|
- Rapid and dramatic increase in shoot length is
Text Solution
|
- Thigmonastic movement is found in
Text Solution
|
- Pr state of phytochrome absorbs light wave-length of
Text Solution
|
- Which one is not correctly matched ?
Text Solution
|
- Opening of floral buds is
Text Solution
|
- Pineapple can be made to produce fruit throughout the year by applicat...
Text Solution
|
- Nutation is shown by
Text Solution
|