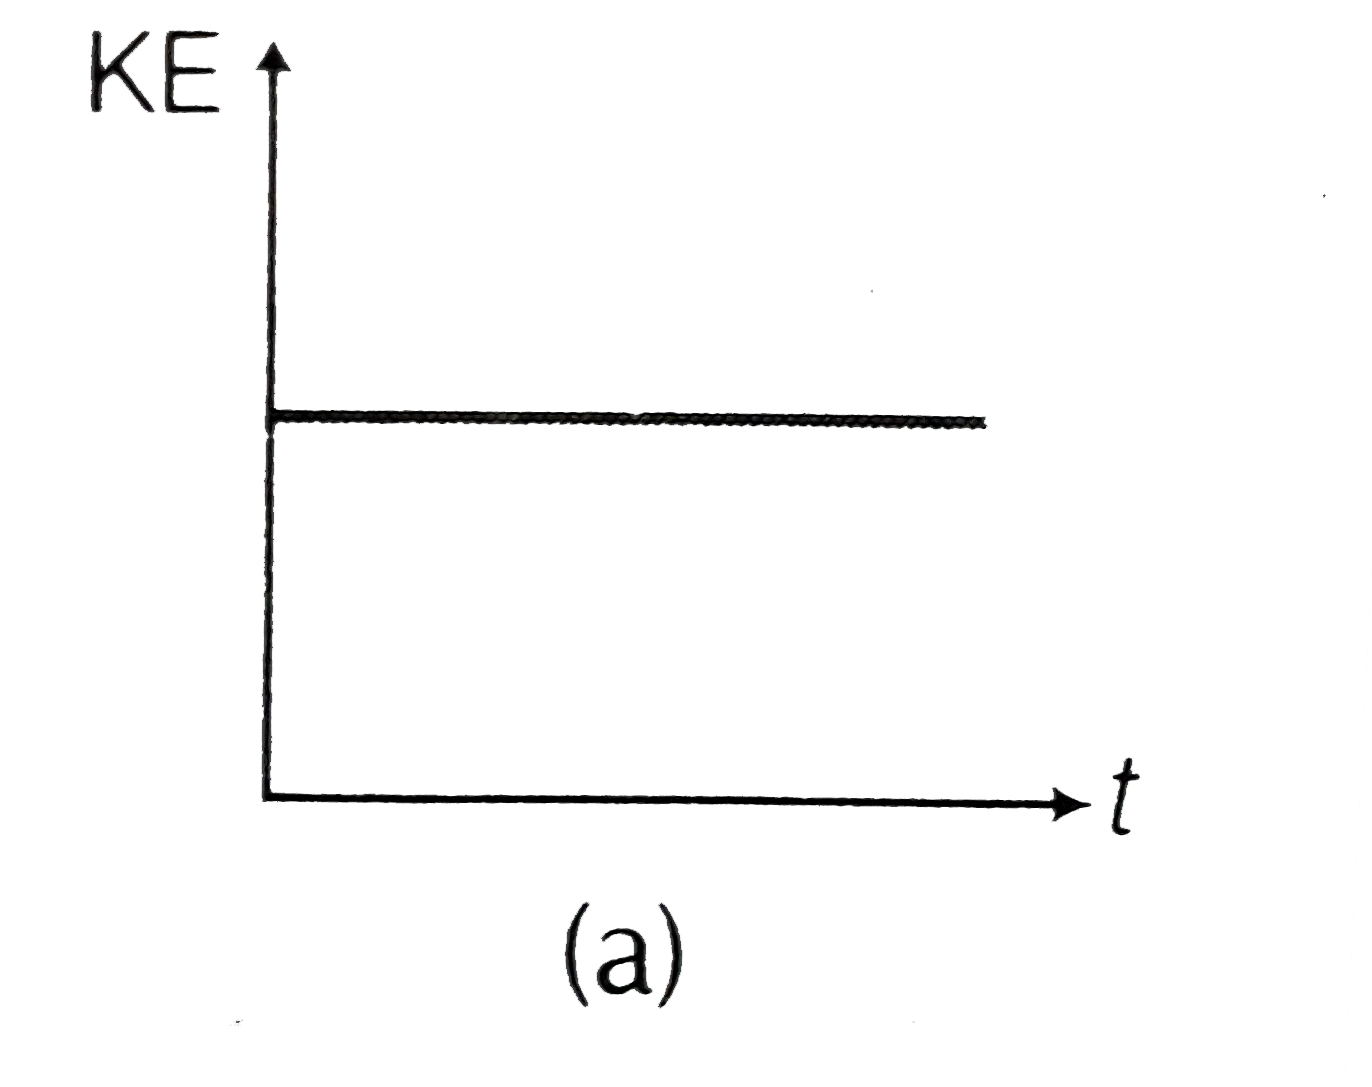
A
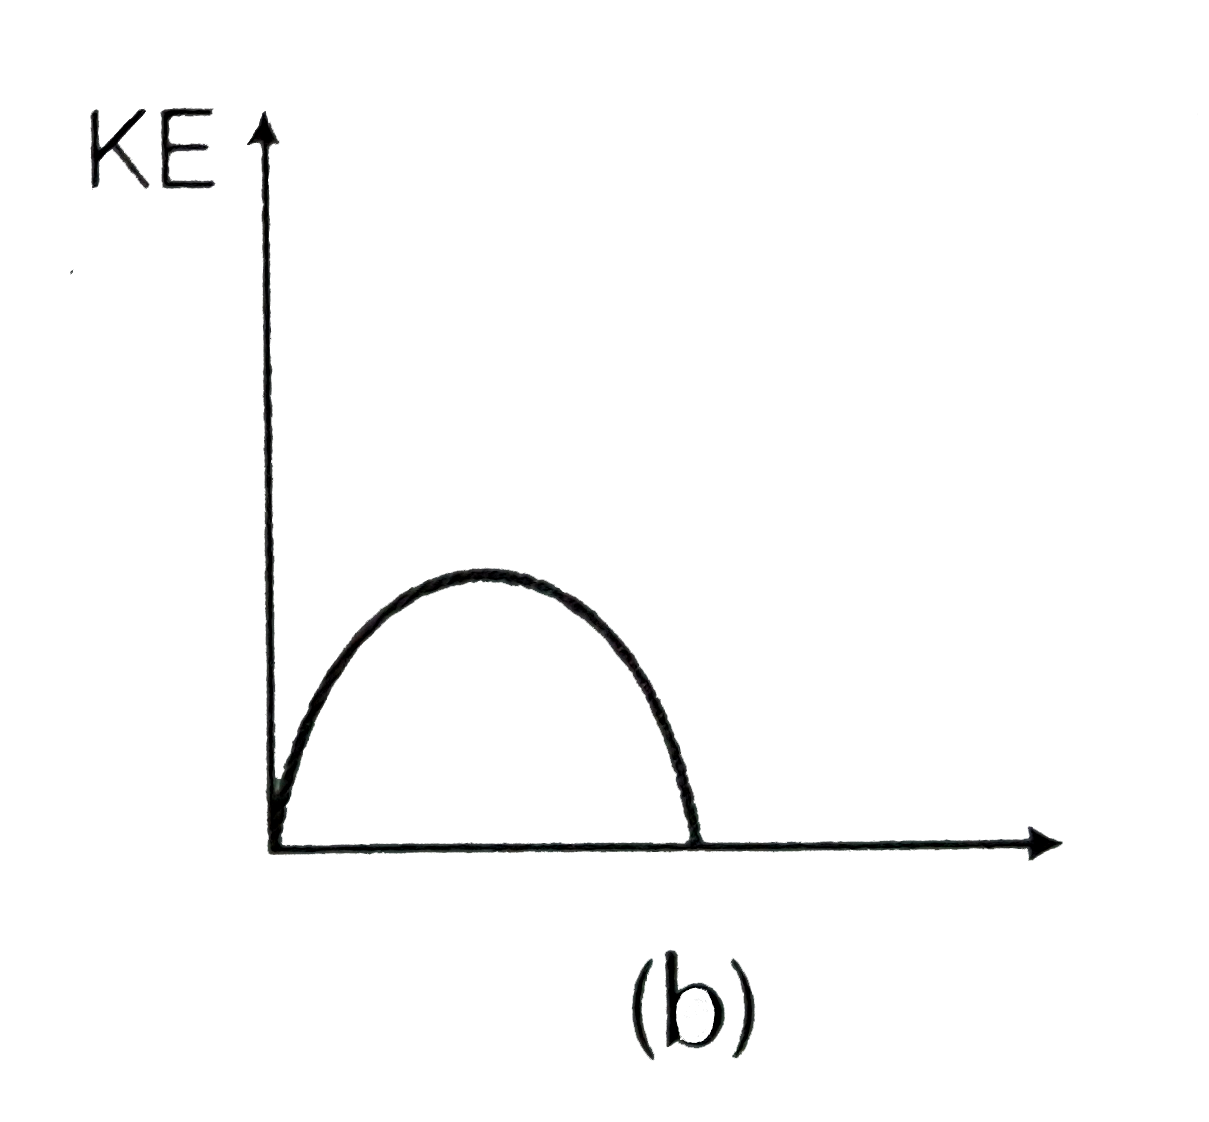
B
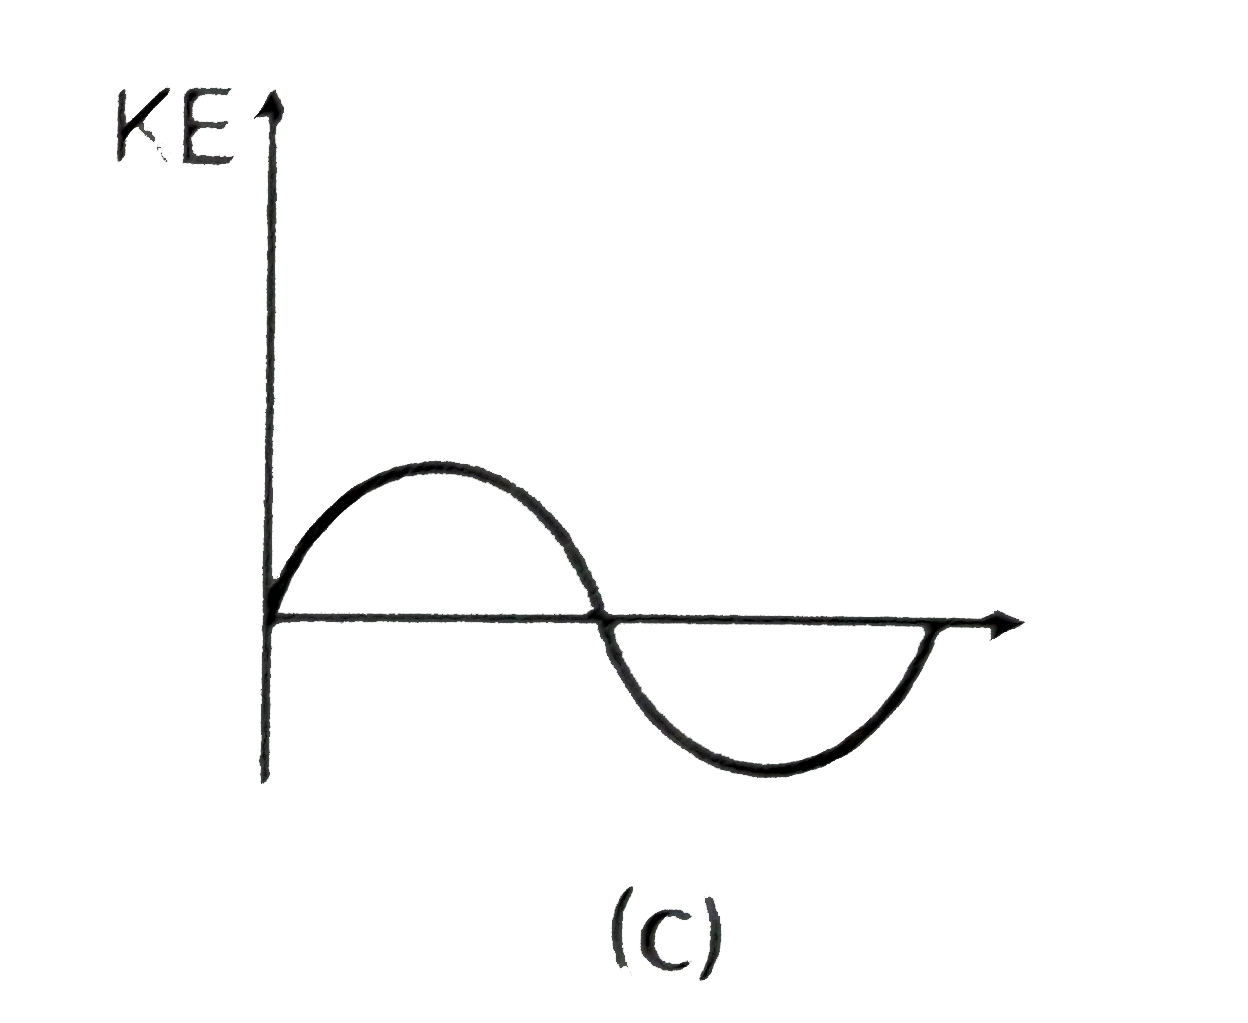
C
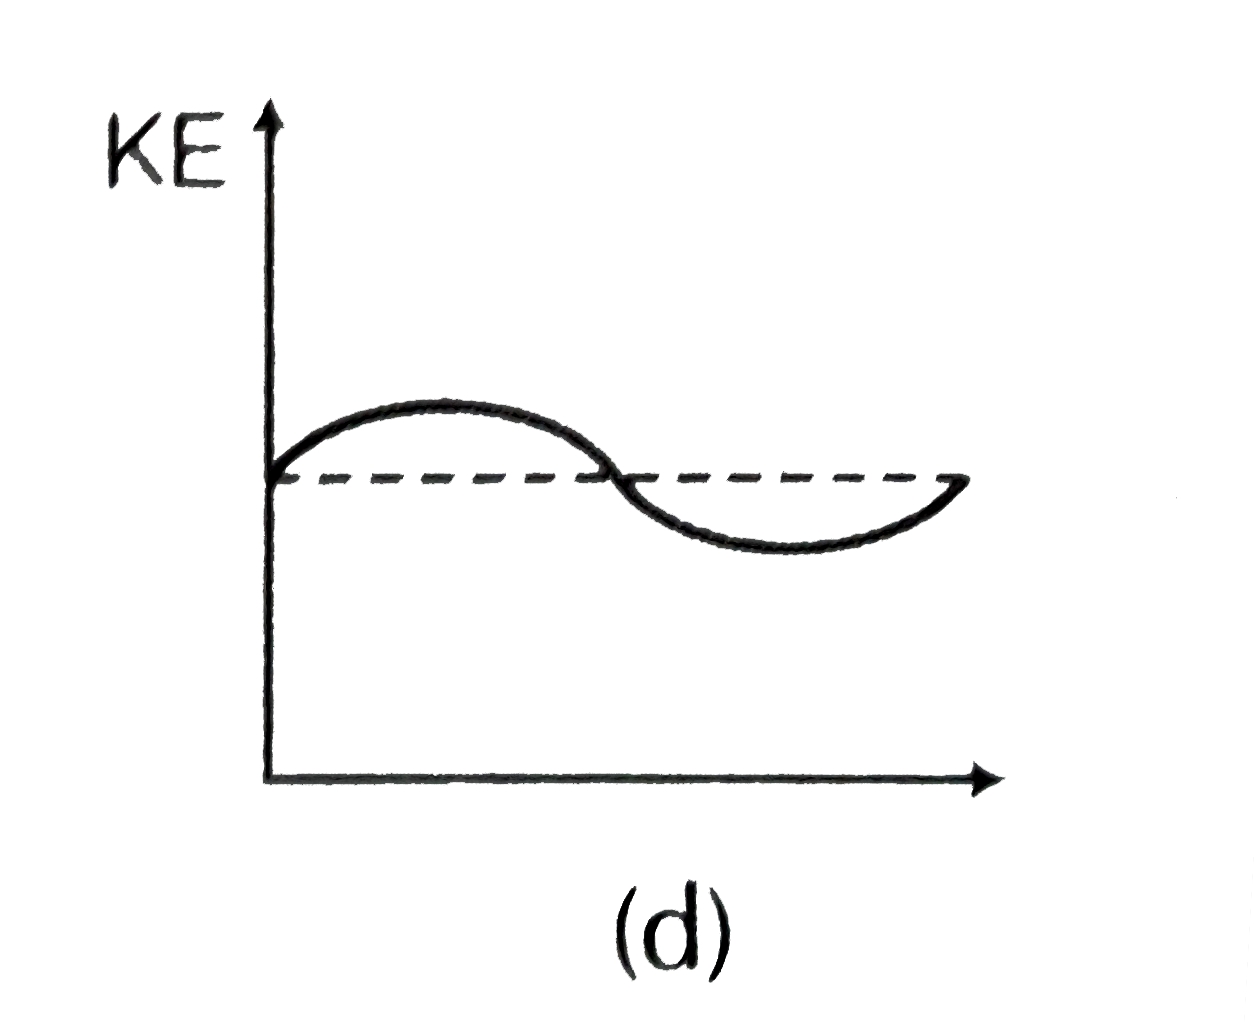
D
Text Solution
Verified by Experts


Similar Questions
Explore conceptually related problems
Recommended Questions
- Which of the diagrams shown in figure. Most closely shows the variatio...
Text Solution
|
- The earth E moves in an elliptical orbit with the sun S at one of the ...
Text Solution
|
- Which of the diagrams shown in figure. Most closely shows the variatio...
Text Solution
|
- धरती सूर्य के चारों ओर दीर्घवृत्तीय (elliptical) कक्षा में चलती हैं । ...
Text Solution
|
- In the figure shown a planet moves in an elliptical orbit around the s...
Text Solution
|
- एक ग्रह सूर्य के चारो ओर एक दीर्घवृत्ताकार कक्षा में घूम रहा है, इसकी ...
Text Solution
|
- Earth is moving around the Sun in elliptical orbit as shown. The ratio...
Text Solution
|
- The Earth E moves in an elliptical orbit with the Sun S at one of the ...
Text Solution
|
- Which of the diagrams shown below most closely shows the variation in ...
Text Solution
|