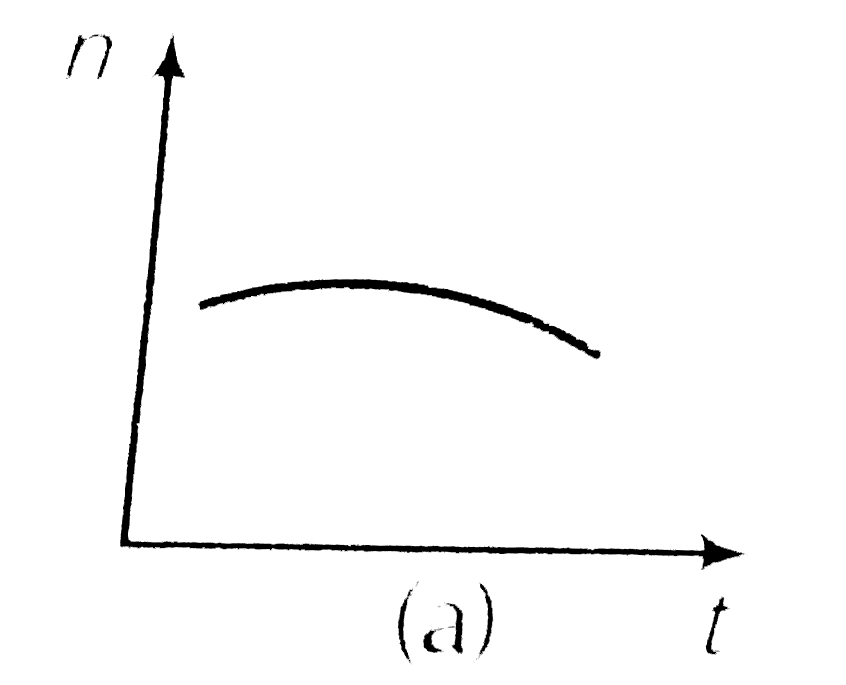
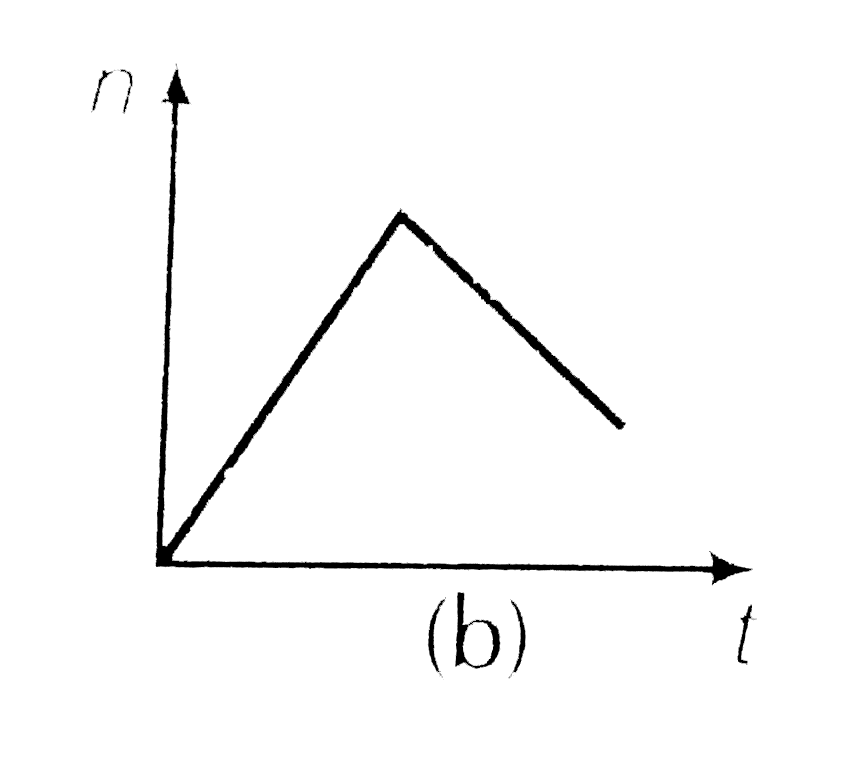
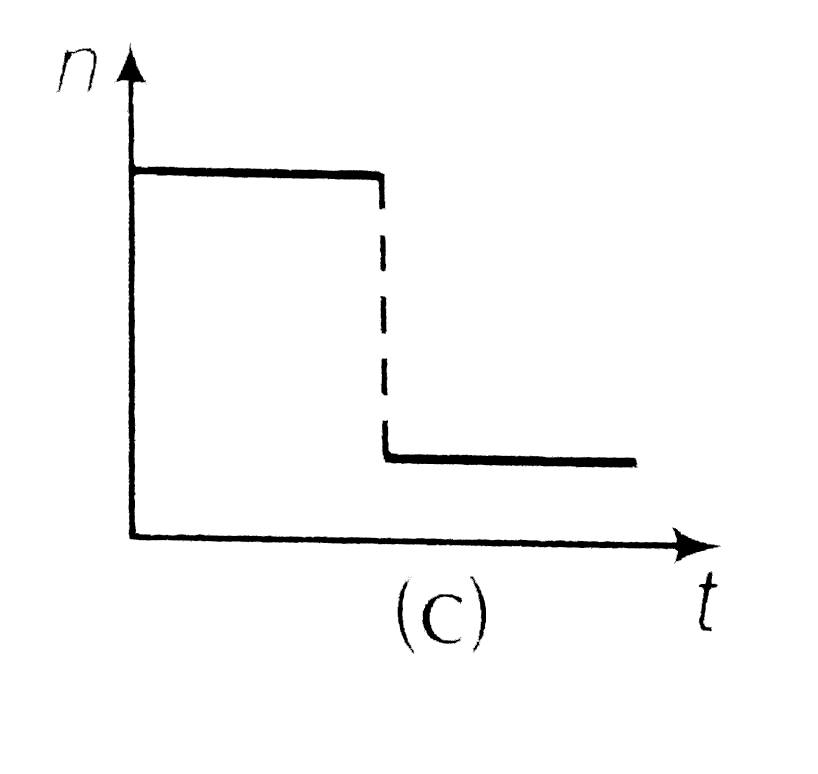
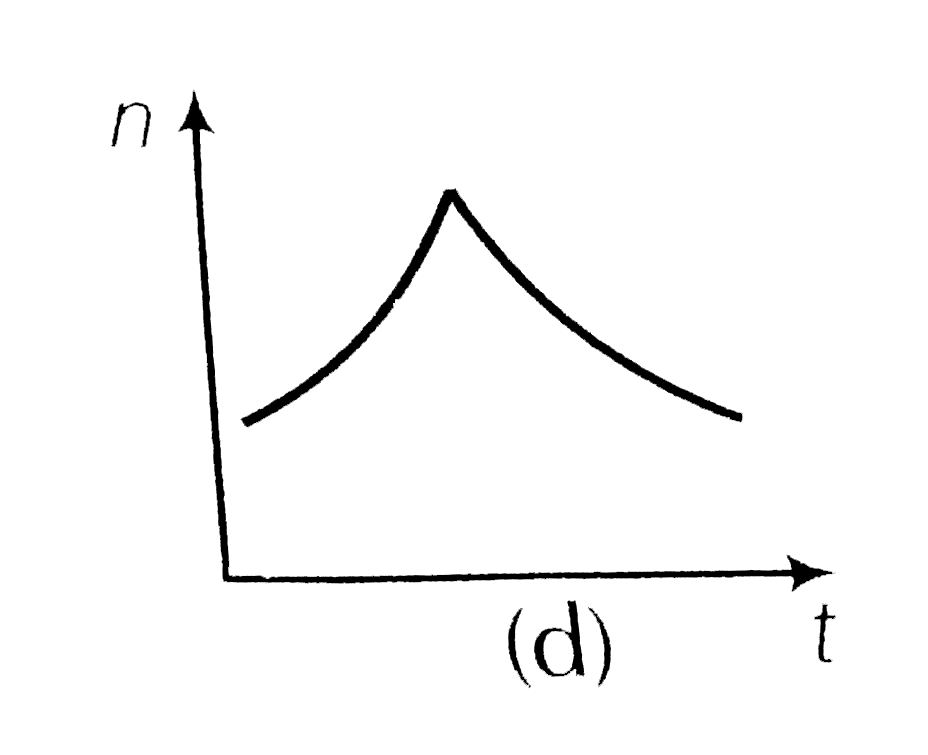
Home
Class 11
PHYSICS
A train whistling at constant frequency ...

A train whistling at constant frequency is moving towards a station at a constant speed V. The train goes past a stationary observer on the station. The frequency `n^(')` of the sound as heard by the observer is plotted as a function of time t, figure. Identify the expected curve.

A

B

C

D

Text Solution

Verified by Experts

The correct Answer is:
C

Let th original frequency of the source is `n_(0)`.
Let the speed of sound wave in the medium is v.
As observer is stationary

Apparent frequecny `n_(a)=((v)/(v-v_(s)))n_(0)" "` [when train is approaching]
`" " =((v)/(v-v_(s)))n_(0)=n_(a)gt n_(0)`
When the train is going away from the observer
Apparent frquency `n_(a)=((v)/(v+v_(s)))n_(0)=n_(a)ltn_(0)`
Hence, the expected curve is (c).
Promotional Banner

Topper's Solved these Questions

  • WAVES

    NCERT EXEMPLAR|Exercise MULTIPLE CHOICE QUESTIONS (MORE THAN ONE OPTIONS )|7 Videos
  • WAVES

    NCERT EXEMPLAR|Exercise VERY SHORT ANSWER TYPE QUESTIONS|7 Videos
  • UNITS AND MEASUREMENTS

    NCERT EXEMPLAR|Exercise Long Answer Type Questions|9 Videos
  • WORK, ENERGY AND POWER

    NCERT EXEMPLAR|Exercise Long answer|1 Videos

Similar Questions

Explore conceptually related problems

A railway engine whistling at a constant frequency moves with a constant speed. It goes past a stationary observer standing beside the railway track. The frequency (n) of the sound heard by the observer is plotted agains time (t) . Which of the following best represents the resulting curve?

A sound source, emitting sound of constant frequency, moves with a constant speed and crosses a stationary observer. The frequency (n) of sound heard by the observer is plotted against time (t). Which of the following graphs represents the correct variation :-

An engine whistling at a constant frequency n_0 and moving with a constant velocity goes past a stationary observer. As the engine crosses him, the frequency of the sound heard by him changes by a factor f. The actual difference in the frequencies of the sound heard by him before and after the engine crosses him is

A train is moving towards a stationary observer. Which of the following curve best represents the frequency recived by observer f aas afunction of time?

A source of sound is travelling towards a stationary observer. The frequency of sound heard by the observer is 25 % more than the actual frequency. If the speed of sound is v , that of the source is

If a source of frequency n moving with velocity v crosses a stationary observer, then the change in the frequency of sound heard by the observer will be (velocity of sound = V)

a bus is moving towards and stationary observer with speed 20 m/s blows a horn of frequency 200 Hz. the frequency of sound heard by the observer is approximately ( take speed of sound 320 m/s)