


RD SHARMA-GRAPHICAL REPRESENTATION OF STATISTICAL DATA-All Questions
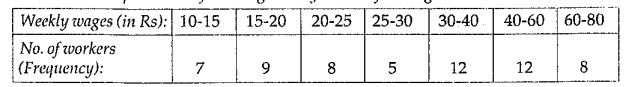
- Represent the following data by means of historgram. Weekly wages (in ...
Text Solution
|
- Construct a frequency polygon for the following data: Age (in year)...
Text Solution
|
- The marks scored by 750 students in an examination are given in the fo...
Text Solution
|
- The given table presents the number of illiterate males in the age gro...
Text Solution
|
- The following are the scores of two groups of class IV students in a...
Text Solution
|
- Find the mode of the following distribution of marks obtained by 80 ...
Text Solution
|
- The following table gives the marks scored by 100 students in an ent...
Text Solution
|
- The expenditure (in 10 crores of rupees) on health by the Govt. of I...
Text Solution
|
- The following data shows the average age of men in various countries...
Text Solution
|
- The results of pass percentage of Class X and XII in C.B.S.E. examin...
Text Solution
|
- The investment (in ten crores of rupees) of the Life Insurance Corpo...
Text Solution
|
- The following data gives the amount of manure (in thousand tonnes) m...
Text Solution
|
- The following data gives the number of students of Delhi state who ...
Text Solution
|
- The following is the distribution of weights (in kg) of 50 persons: ...
Text Solution
|
- The population of four major cities in India in a particular year i...
Text Solution
|
- In a school, there are five sections of class IX. The number of stu...
Text Solution
|
- The following table gives the number of students in Class IX in a sc...
Text Solution
|
- Read the bar graph shown in Figure and answer the following question...
Text Solution
|
- The following bar graph shows the number of vehicles passing through...
Text Solution
|
- Read the bar graph shown in Figure and answer the following questio...
Text Solution
|