Text Solution
Verified by Experts


Similar Questions
Explore conceptually related problems
Recommended Questions
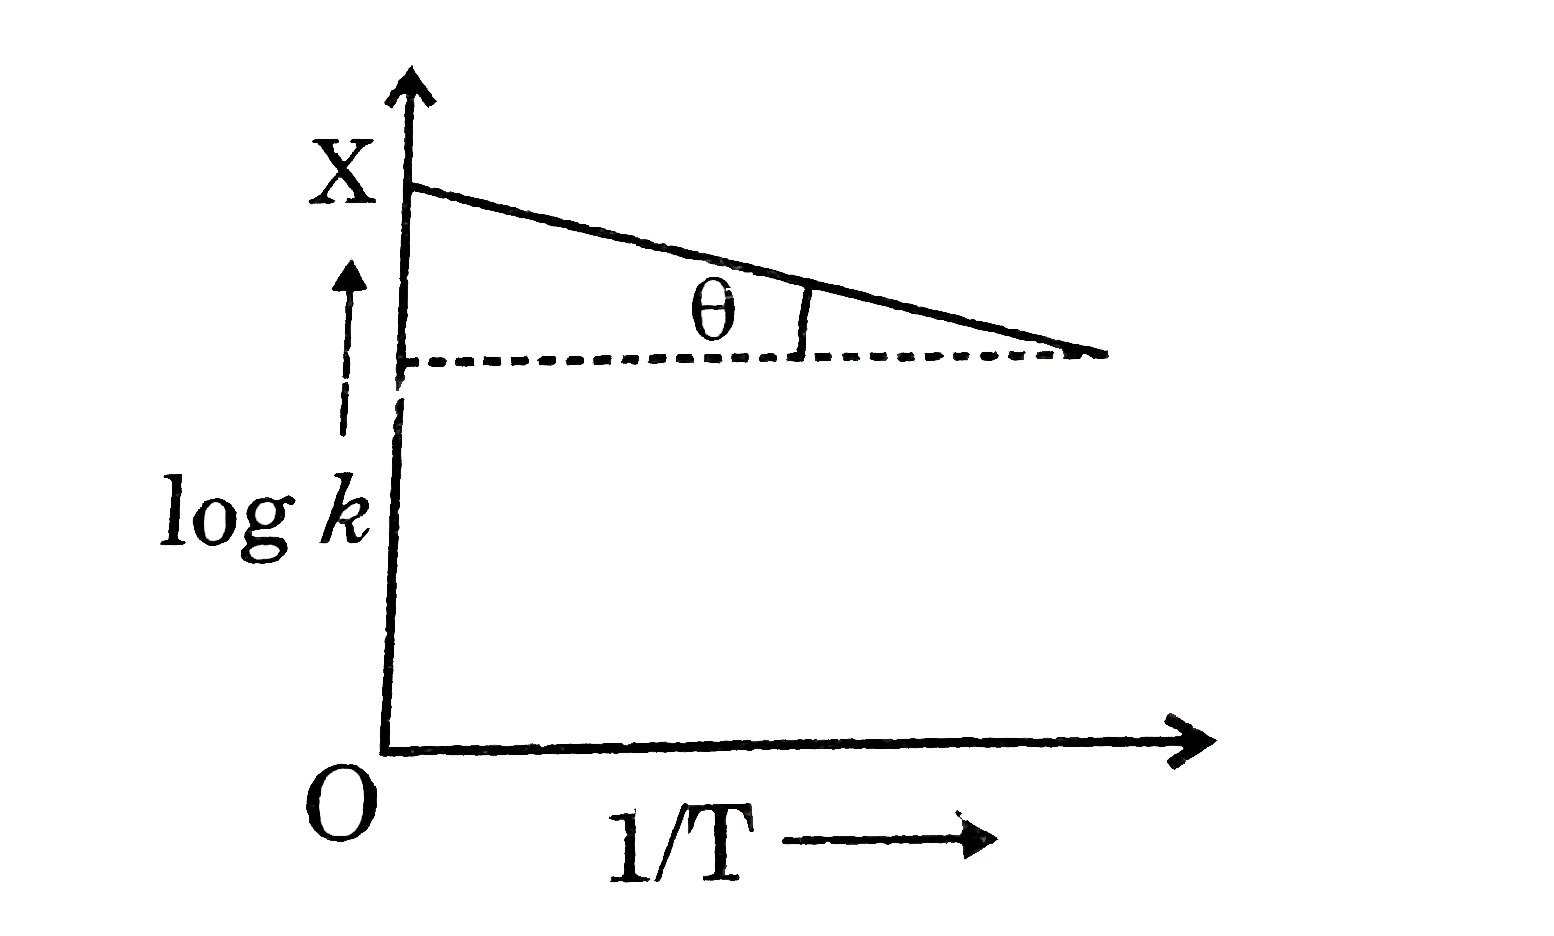
- Graph between log k and (1)/(T) (k is rate constant in s^(-1) and T is...
Text Solution
|
- Graph between log k and 1//T [k rate constant (s^(-1)) and T and the t...
Text Solution
|
- The graph between log k versus 1//T is a straight line.
Text Solution
|
- Graph between log k and (1)/(T) (k is rate constant in s^(-1) and T is...
Text Solution
|
- The slope of straight line graph between ln k us (1)/(T) is equal to 2...
Text Solution
|
- Graph between log k and 1//T [where K is rate constant in s^(-1) and T...
Text Solution
|
- The rate constant 'k'. For a reaction varies with temperature 'T' acco...
Text Solution
|
- The graph between log k and 1/T[K is rate constant (sec^(-1)) and T th...
Text Solution
|
- If a graph is plotted between ln k and 1//T for the first order reacti...
Text Solution
|