A
B
C
D
Text Solution
Verified by Experts
The correct Answer is:


Similar Questions
Explore conceptually related problems
Recommended Questions
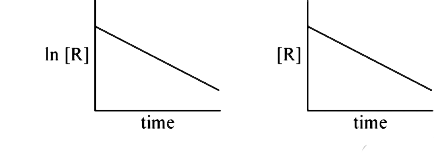
- The given plots represent the variation of the concentration of a reac...
Text Solution
|
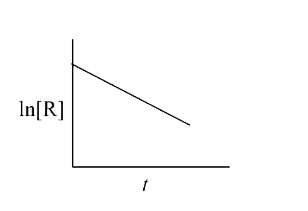
- For a chemical reactin R rarr P, variation of concentration of R vs ti...
Text Solution
|
- A reaction is second order with respect to a reactant. How is the rate...
Text Solution
|
- A reaction is second order with respect to a reactant. How is the rate...
Text Solution
|
- A reaction is second order with respect to a reactant. How is the rate...
Text Solution
|
- The given plots represent the variation of the concentration of a reac...
Text Solution
|
- The given plots represent the variation of the concentration of a reac...
Text Solution
|
- The given plots represent the variation of the concentration of a reac...
Text Solution
|
- For a chemical reaction R to P, the variation in the concentration (R)...
Text Solution
|