Home
Class 10
MATHS
The number of students absent in a schoo...

The number of students absent in a school was recorded every day for 147 days and the raw data was presented in the form of the following frequency table.

Obtain the median and describe what information it conveys.

Text Solution

Verified by Experts

Given,
`[[x_i​,f_i​ ,c_f],[5,1,1],[6,5,6],[7,11,17],[8,14,31],[9,16,47],[10,13,60],[11,10,70],[12,70,140],[13,4,144],[15,1,145],[18,1,146],[20,1,147]]`
Here,`sumf_i​=147`
We have, `N=147=>N/2​=73.5`
The cumulative frequency just greater than `N/2` is 140 and the corresponding value of the variable x is 12.
Hence, median = 12.
This means that for about half the number of days, more than 12 students were absent.
Promotional Banner

Topper's Solved these Questions

  • SOME APPLICATIONS OF TRIGONOMETRY

    RD SHARMA|Exercise All Questions|154 Videos
  • SURFACE AREAS AND VOLUMES

    RD SHARMA|Exercise All Questions|417 Videos

Similar Questions

Explore conceptually related problems

The number of students absent in a class were recorded every day for 120 days and the information is given in the following frequency table: No. of students absent (x) : 0 1 2 3 4 5 6 7 No. of days (f) : 1 4 10 50 34 15 4 2 Find the mean number of students absent per day.

The distances covered by 250 public transport buses in a day is shown in the following frequency distribution table. Find the median of the distances.

The distances covered by 250 pubic transport buses in a day is shown in the following frequency distribution table. Find the median of the distances.

On an envirnoment day, students in a school planted 120 trees under plantation project. The information regarding the project is shown in the following table. Show it by a pie diagram.

On an environment day, students in a school planted 120 trees under plantation project. The information regarding the project is shown in the following table. Show it by a pie diagram.

The time required for students to do a science experiment and the number of students is shown in the following grouped frequency distribution table. Show information by a histogram and also by a frequency polygon.

50 students enter for a school javeloin throw competition. The distance (in metre) thrown are recorded below (i) Construct a cumulative frequency table. (ii)Calculate the median distance by using the formula for median.

The table below shows number of students of students of a college corresponding to different range of marks in Statistics. Present the information in the form of a histogram.

The following data shows the number of students who attended the school on weekdays. Draw a bar graph to represent information by using appropriate scale.

RD SHARMA-STATISTICS-All Questions
  1. Find the mean marks of the students from the following cumulative fr...

    Text Solution

    |

  2. Find the mean marks of students from the following cumulative frequenc...

    Text Solution

    |

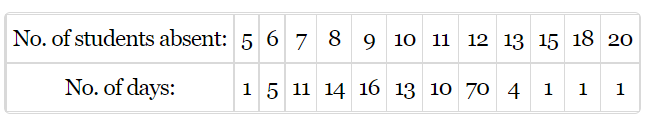
  3. The number of students absent in a school was recorded every day for ...

    Text Solution

    |

  4. Compute the median form the following data: Mid-value:          115   ...

    Text Solution

    |

  5. Find the median of the following frequency distribution: Weekly wages ...

    Text Solution

    |

  6. If the median of the following frequency distribution is 46, find the ...

    Text Solution

    |

  7. Calculate the median from the following data: Marks:                0-...

    Text Solution

    |

  8. Find the mode of the following data: 25,16,19,48,19,20,34,15,19,20,21,...

    Text Solution

    |

  9. Compute the median for the following cumulative frequency distribution...

    Text Solution

    |

  10. In Figure, A B C is right angled at ,B C=7c m and A C-A B=1c m . Find...

    Text Solution

    |

  11. In Figure, Pa n dQ are the midpoints of the sides C Aa n dC B respecti...

    Text Solution

    |

  12. Diagonals of a trapezium ABCD with AB || DC intersect each other at...

    Text Solution

    |

  13. The mean of the following frequency distribution is 50. Find the value...

    Text Solution

    |

  14. If s e c4A=cos e c(A-20^@) , where 4A is an acute angle, find the ...

    Text Solution

    |

  15. Find the mode of the following data: Class :0-20, 20-40 ,40-60 ,60-80...

    Text Solution

    |

  16. Theorem 6.9 : In a triangle, if square of one side is equal to the sum...

    Text Solution

    |

  17. If a line is drawn to one side of a triangle to intersect the other tw...

    Text Solution

    |

  18. Prove that : (tantheta)/(1-cottheta)+(cottheta)/(1-tantheta)=1+sect...

    Text Solution

    |

  19. Without using trigonometric tables, evaluate the following: (sec37^0)/...

    Text Solution

    |

  20. Find the mode of the following distribution of marks obtained by 80 ...

    Text Solution

    |