To solve the problem of identifying the representation of the straight line given by the equation \( y = -2x + 5 \), we can follow these steps:
### Step 1: Identify the slope and y-intercept
The equation of the line is in the slope-intercept form, which is given by:
\[ y = mx + c \]
where \( m \) is the slope and \( c \) is the y-intercept.
From the equation \( y = -2x + 5 \):
- The slope \( m = -2 \)
- The y-intercept \( c = 5 \)
### Step 2: Understand the implications of the slope and intercept
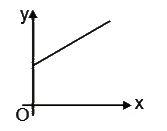
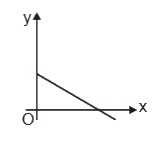
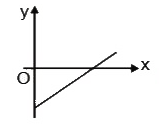
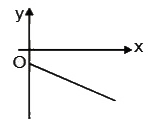
The slope \( m = -2 \) indicates that the line is decreasing. A negative slope means that as \( x \) increases, \( y \) decreases. The y-intercept \( c = 5 \) indicates that the line crosses the y-axis at the point \( (0, 5) \).
### Step 3: Plot the y-intercept
To plot the line, we start by marking the y-intercept on the graph:
- At \( x = 0 \), \( y = 5 \). So, we plot the point \( (0, 5) \).
### Step 4: Find another point using the slope
Using the slope \( m = -2 \), we can find another point on the line. The slope can be interpreted as:
\[ \text{slope} = \frac{\Delta y}{\Delta x} = -2 \]
This means that for every increase of 1 in \( x \), \( y \) decreases by 2.
Starting from the point \( (0, 5) \):
- If \( x = 1 \), then \( y = 5 - 2(1) = 3 \). So, we have another point \( (1, 3) \).
### Step 5: Plot the second point
Now, we plot the point \( (1, 3) \) on the graph.
### Step 6: Draw the line
Now that we have two points \( (0, 5) \) and \( (1, 3) \), we can draw a straight line through these points. This line represents the equation \( y = -2x + 5 \).
### Step 7: Analyze the graph
The graph will show a straight line that slopes downward from left to right, confirming that the slope is negative. The line crosses the y-axis at \( (0, 5) \).
### Conclusion
The straight line represented by the equation \( y = -2x + 5 \) is a line with a negative slope that intersects the y-axis at \( 5 \).
---