A
B
C
D
Text Solution
Verified by Experts
The correct Answer is:


Similar Questions
Explore conceptually related problems
Recommended Questions
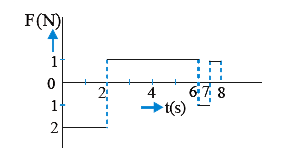
- A force-time graph for the motion of a body is shown in fig. Change in...
Text Solution
|
- The displacement-time graph of a body is shown in. . The velocity-...
Text Solution
|
- A force-time graph for the motion of a body is shown in the figure. Th...
Text Solution
|
- For a body of given mass graph between velocity of the body and its li...
Text Solution
|
- Assertion : Torque is time rate of change of a parameter, called angua...
Text Solution
|
- A force time graph for the motion of a body is as shown in Change in l...
Text Solution
|
- A force - time graph for a linear motion is shown in the figure where ...
Text Solution
|
- The velocity time graph of a body is shown in fig. it indicates that :
Text Solution
|
- A force time graph for the motion of a body is as shown in figure. Cha...
Text Solution
|