Home
Class 12
PHYSICS
In the above question, the curve between...

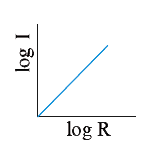
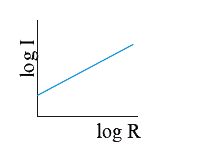
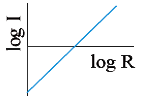
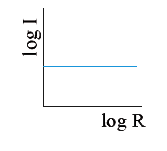
In the above question, the curve between log I and log R will be :

A

B

C

D

Text Solution

AI Generated Solution

The correct Answer is:
To solve the problem, we need to analyze the relationship between the moment of inertia \( I \) of a solid cylinder and its radius \( R \). The moment of inertia about the axis through the center of mass for a solid cylinder is given by the formula: \[ I = \frac{1}{2} m R^2 \] Where: - \( I \) is the moment of inertia, - \( m \) is the mass of the cylinder, - \( R \) is the radius of the cylinder. ### Step 1: Express the Moment of Inertia in Terms of Logarithms We can take the logarithm of both sides of the equation to analyze the relationship between \( \log I \) and \( \log R \): \[ \log I = \log\left(\frac{1}{2} m R^2\right) \] Using the properties of logarithms, we can separate the terms: \[ \log I = \log\left(\frac{1}{2}\right) + \log m + \log R^2 \] Further simplifying, we have: \[ \log I = \log\left(\frac{1}{2}\right) + \log m + 2 \log R \] ### Step 2: Rearranging the Equation We can rearrange the equation to express it in the form of a linear equation \( y = mx + c \): \[ \log I = 2 \log R + \left(\log m + \log\left(\frac{1}{2}\right)\right) \] Here, we can identify: - \( y = \log I \) - \( x = \log R \) - The slope \( m = 2 \) - The y-intercept \( c = \log m + \log\left(\frac{1}{2}\right) \) ### Step 3: Analyzing the Graph From the equation \( \log I = 2 \log R + c \), we can see that if we plot \( \log I \) on the y-axis and \( \log R \) on the x-axis, the graph will be a straight line with: - A slope of 2, - A y-intercept of \( c \). ### Conclusion The curve between \( \log I \) and \( \log R \) will be a straight line with a slope of 2. This indicates that as the radius \( R \) increases, the moment of inertia \( I \) increases quadratically.
Promotional Banner

Similar Questions

Explore conceptually related problems

When a current I is passed through a wire of constant resistance, it produces a potential difference V across its ends. The graph drawn between log I and log V will be

The curve x = log y+ e and y = log (1/x)

The current curve between log_e""(j)/(T^2)" and "l/T

The correct curve between log_(e) R and log_(e) (theta - theta_(o) ) is -

Sketch the curve y=log|x|

The area of the region bounded by the curves y=ex log x and y=(log x)/(ex) is

The area between the curves y=ln x and y=(ln x)^(2) is

If a,b,c are the p^("th") , q^("th") and r^("th") terms of G.P then the angle between the vector vecu = (log a) hati + (log b)hatj + (log c) hatk and vecv -( q -r) hati + ( r -p) hati + ( r-p) hatj + ( p-q) hatk , is

Figure shows, the adiabatic curve on a log T and log V scale performed on ideal gas. The gas is -