A
B
C
D
Text Solution
Verified by Experts
The correct Answer is:


Similar Questions
Explore conceptually related problems
Recommended Questions
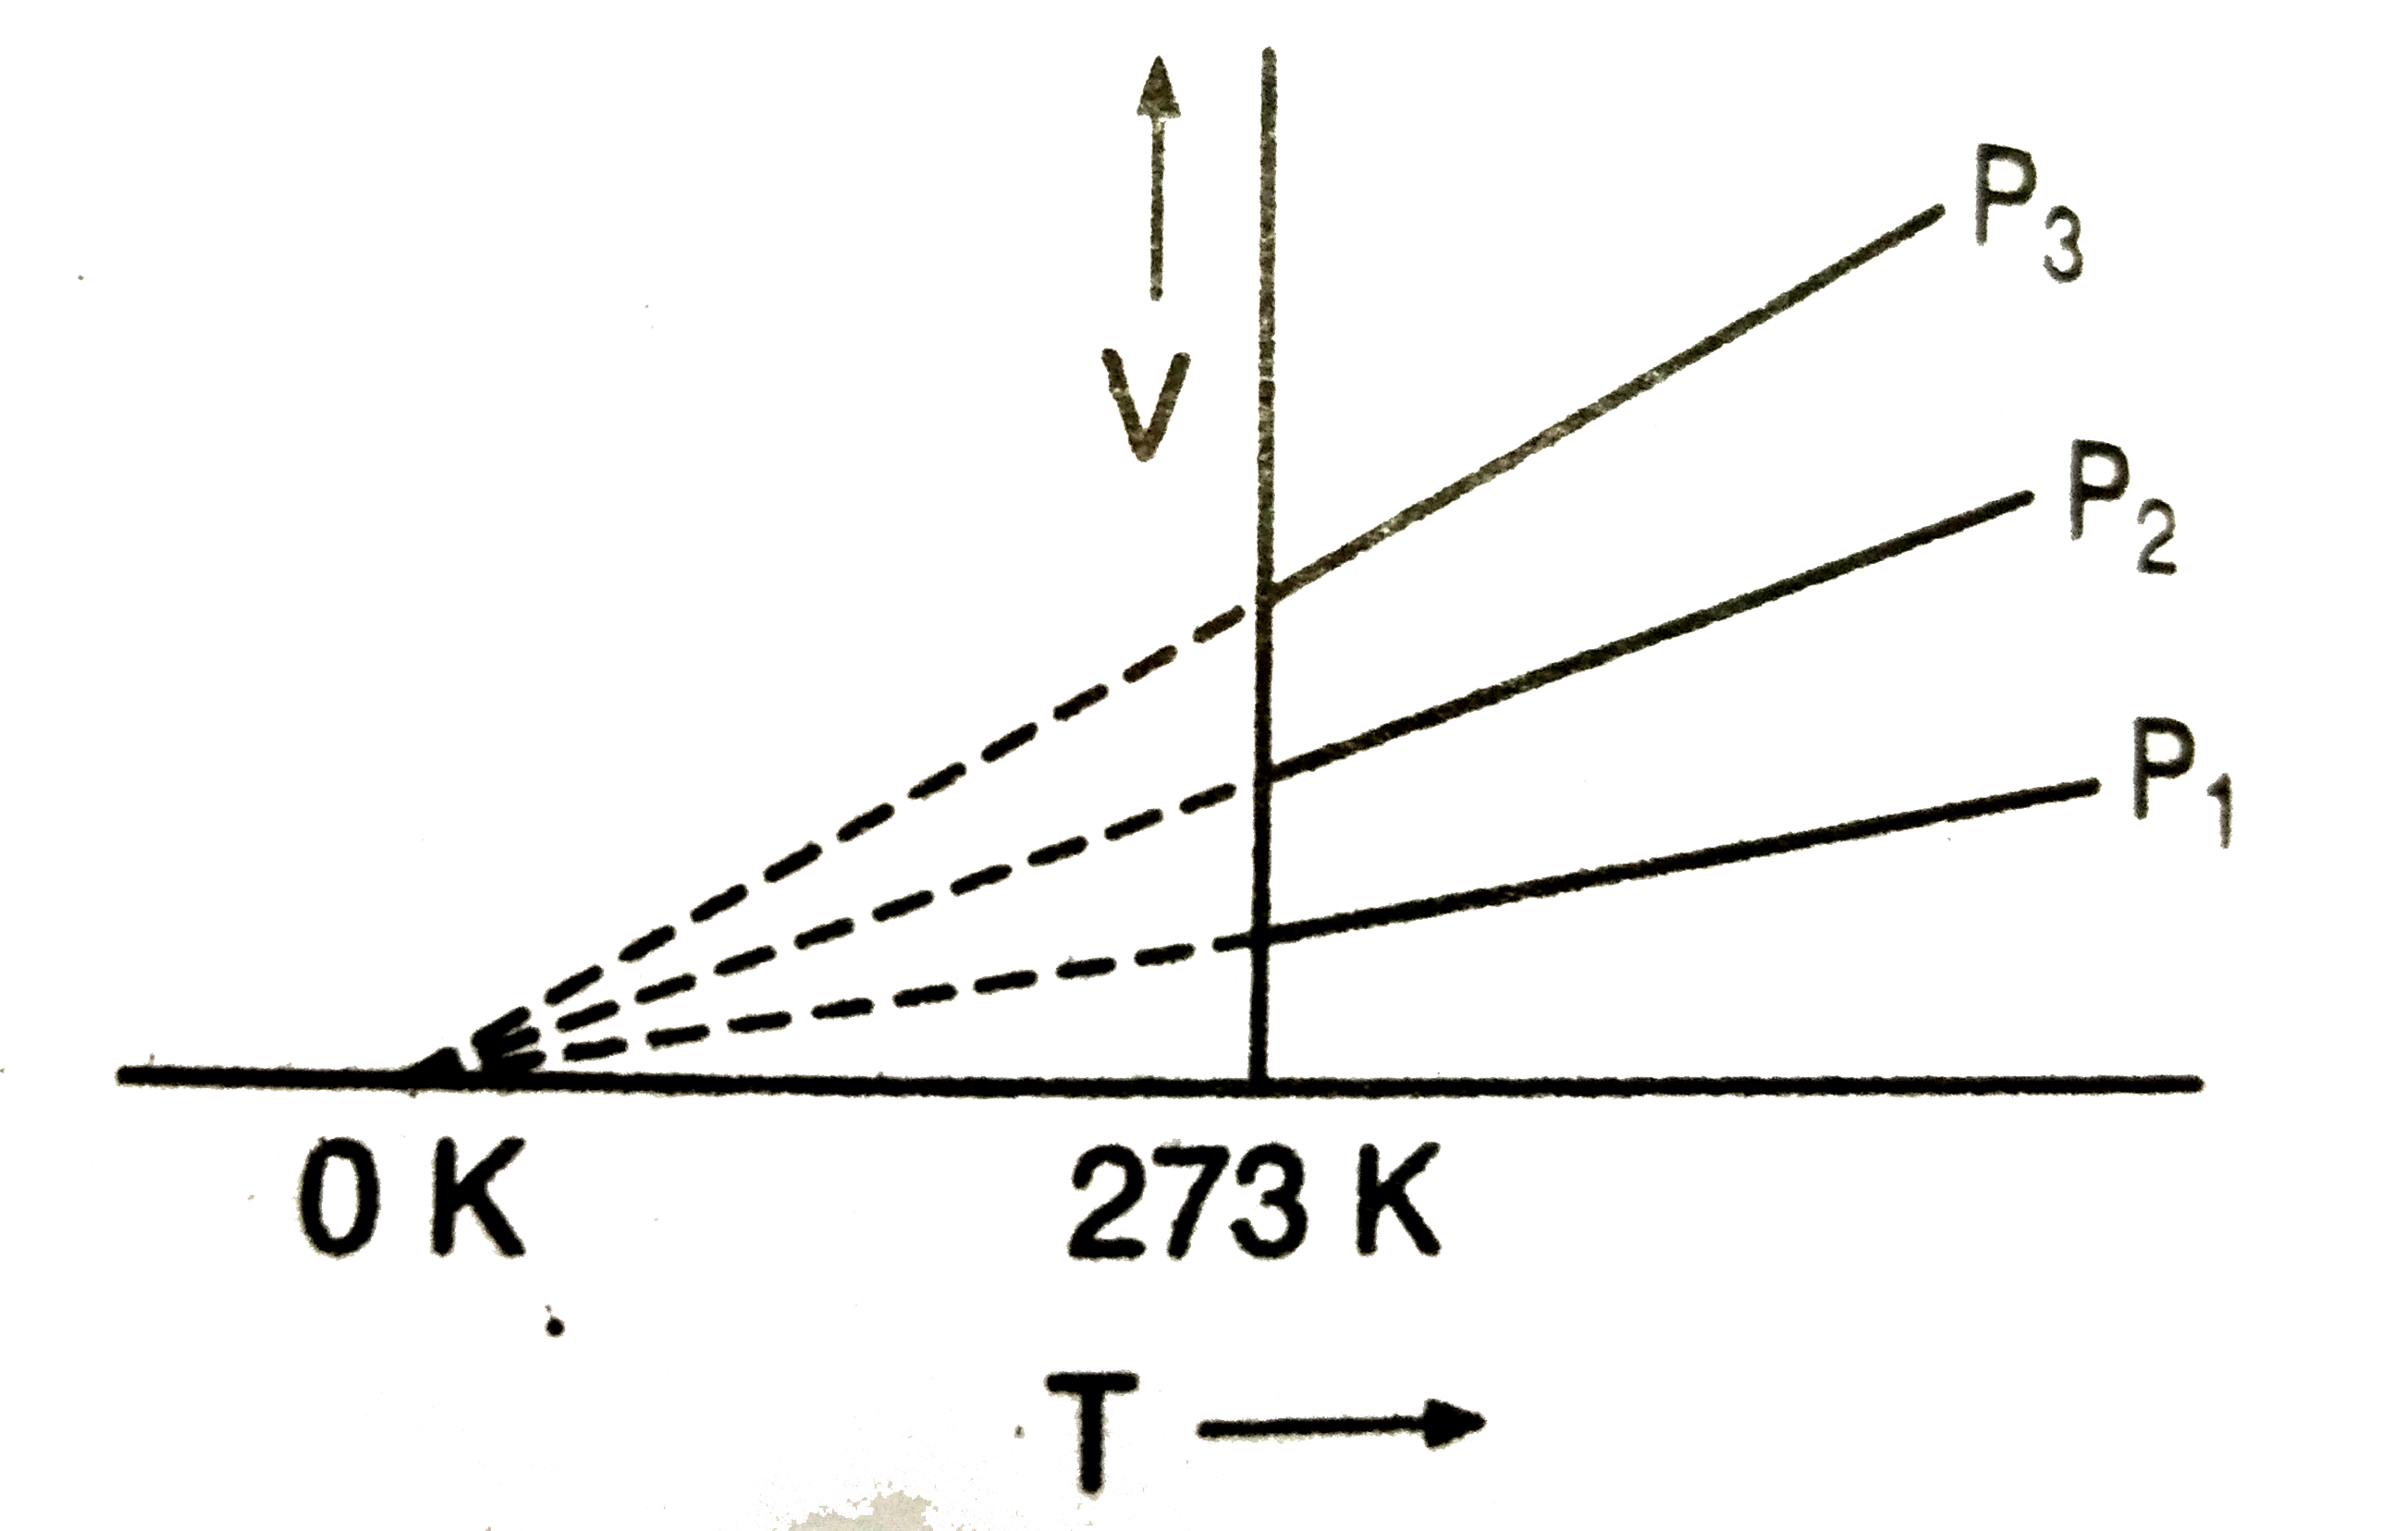
- The volume-temperature graphs of a given mass of an ideal gas at const...
Text Solution
|
- Pressure versus temperature graph of an ideal gas at constant volume V...
Text Solution
|
- The volume-temperature graphs of a given mass of an ideal gas at const...
Text Solution
|
- Volume of a given mass of an ideal gas is VL at 27^(@)C and 1 atm pres...
Text Solution
|
- The raise in the temperature of a given mass of an ideal gas at consta...
Text Solution
|
- स्थिर दाब पर आदर्श गैस के दिये गए द्रव्यमान का आयतन तापमान ग्राफ नीचे ...
Text Solution
|
- नियत दाब पर, किसी गैस के दिए गए मात्रा का आयतन, तापक्रम के फलन के अनुर...
Text Solution
|
- The volume-temperature graphs of a given mass of an ideal gas at const...
Text Solution
|
- Two different at constant. The relationship between volume V and the p...
Text Solution
|