Home
Class 11
CHEMISTRY
Which of the following plots does not re...

Which of the following plots does not represent Boyle's law?

A

B

C

D

Text Solution

Verified by Experts

The correct Answer is:
B

(c) Boyle's Law
Temperature and mass=constant
PV=K
log P=log K- log V
Promotional Banner

Topper's Solved these Questions

  • GASEOUS STATE

    NARENDRA AWASTHI|Exercise Level 1 (Q.31 To Q.60)|1 Videos
  • GASEOUS STATE

    NARENDRA AWASTHI|Exercise Level 1 (Q.121 To Q.150)|1 Videos
  • ELECTROCHEMISTRY

    NARENDRA AWASTHI|Exercise Level 3 - Subjective Problems|1 Videos
  • IONIC EEQUILIBRIUM

    NARENDRA AWASTHI|Exercise Exercise|196 Videos

Similar Questions

Explore conceptually related problems

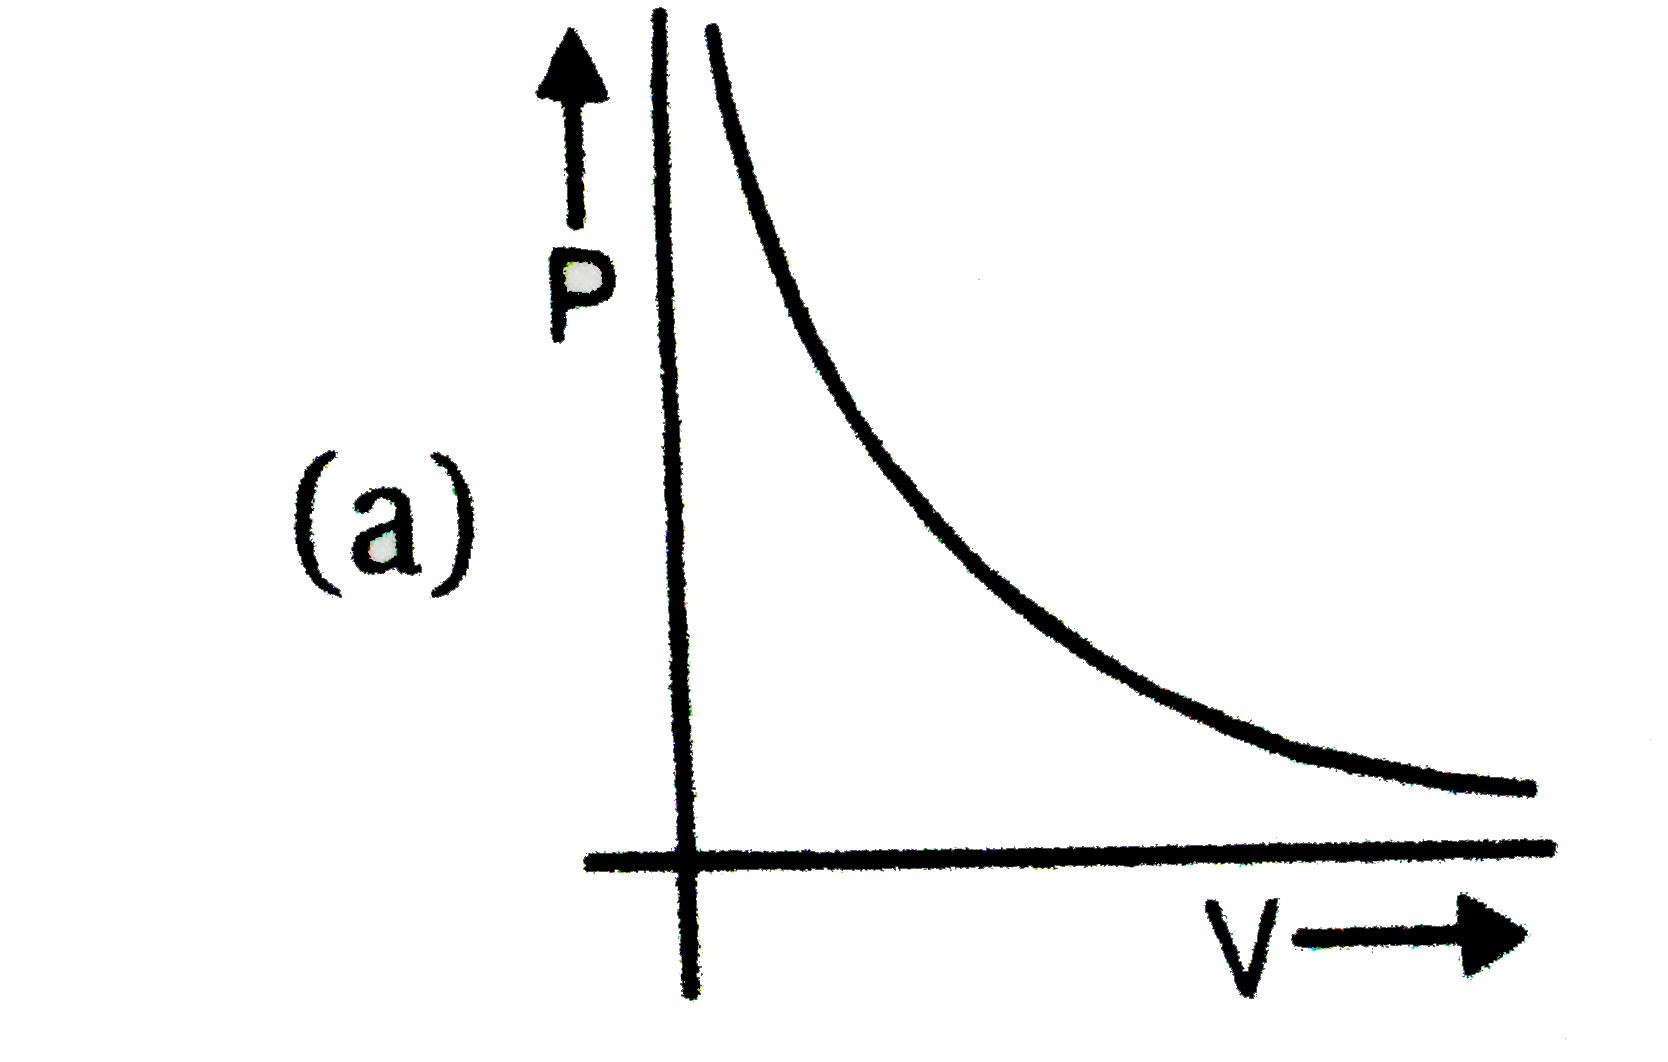
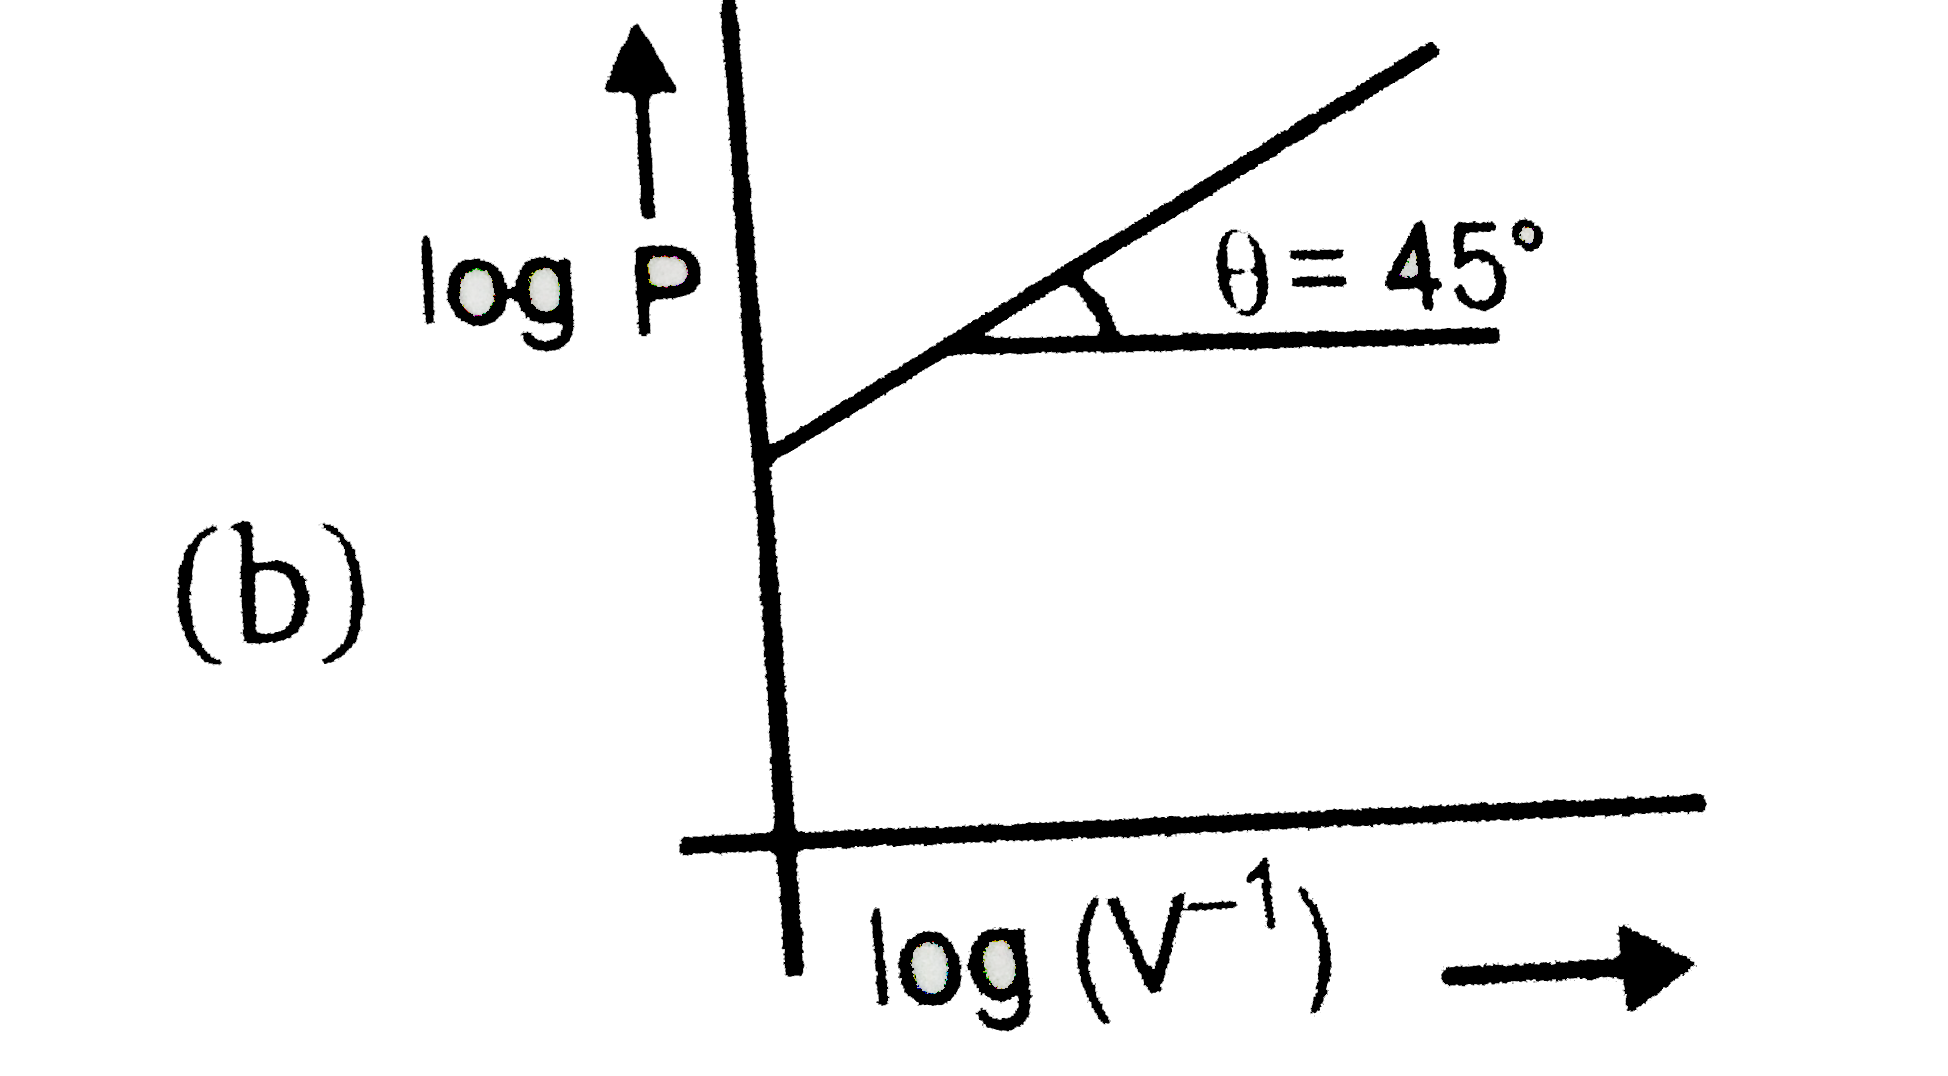
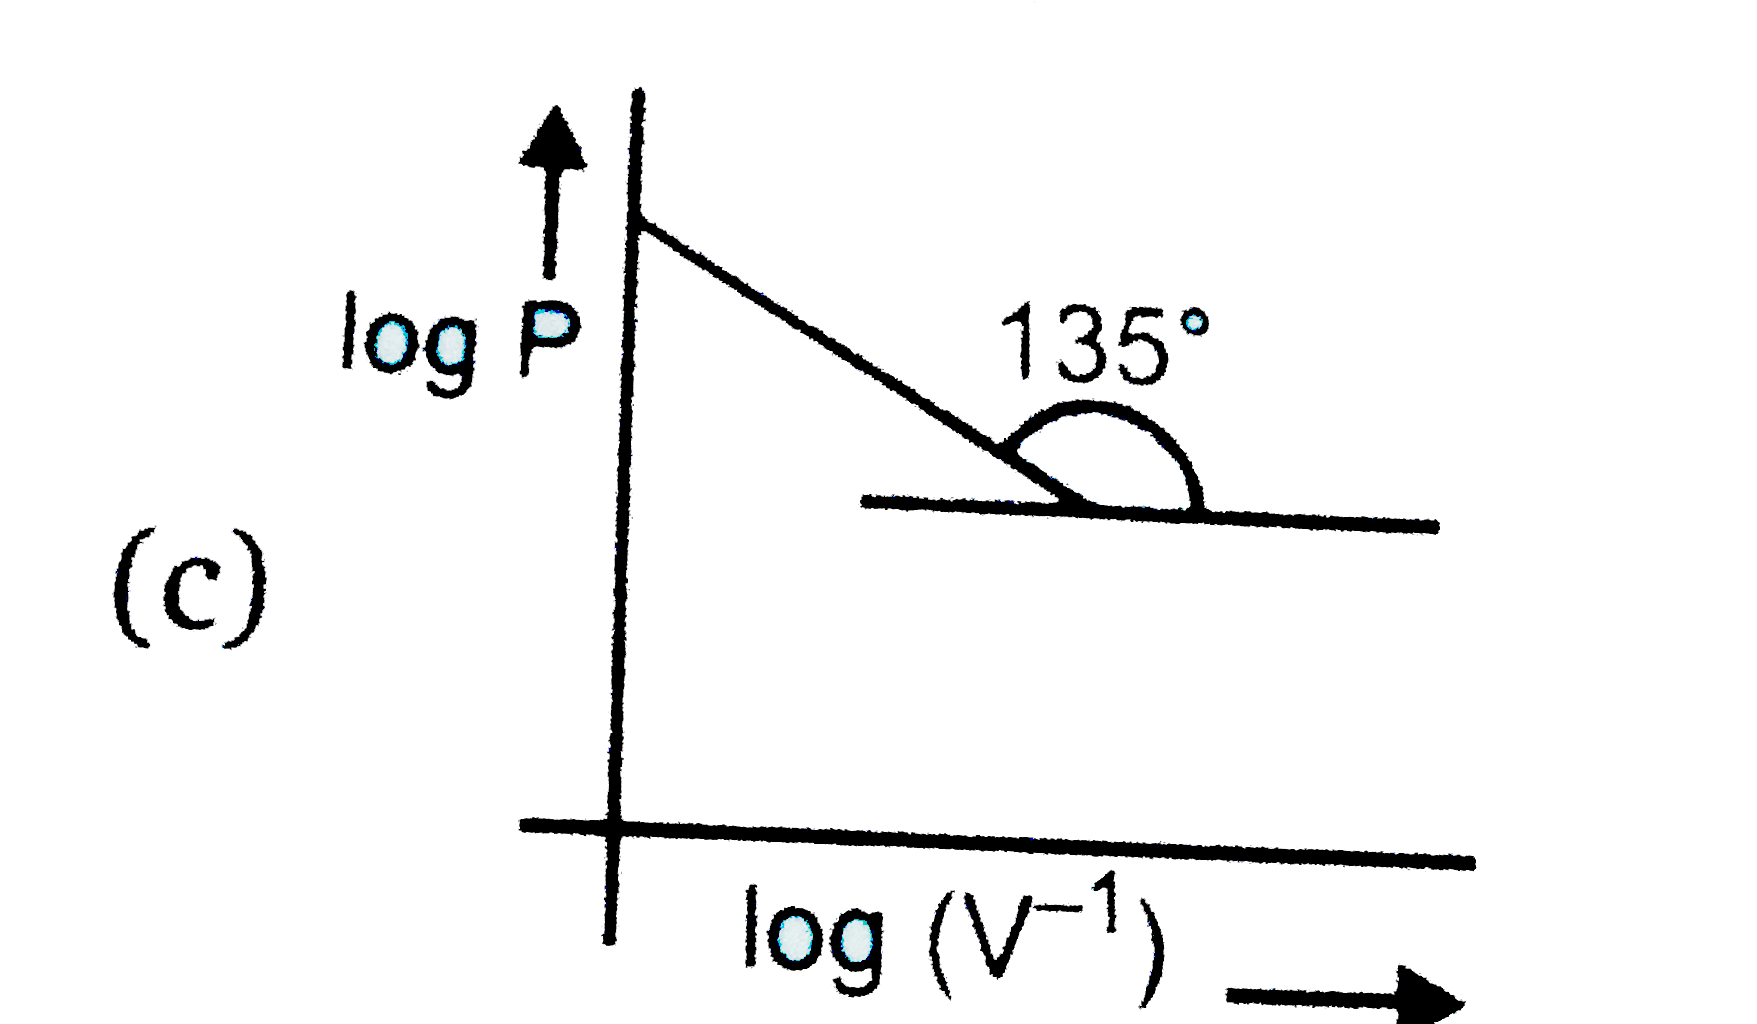
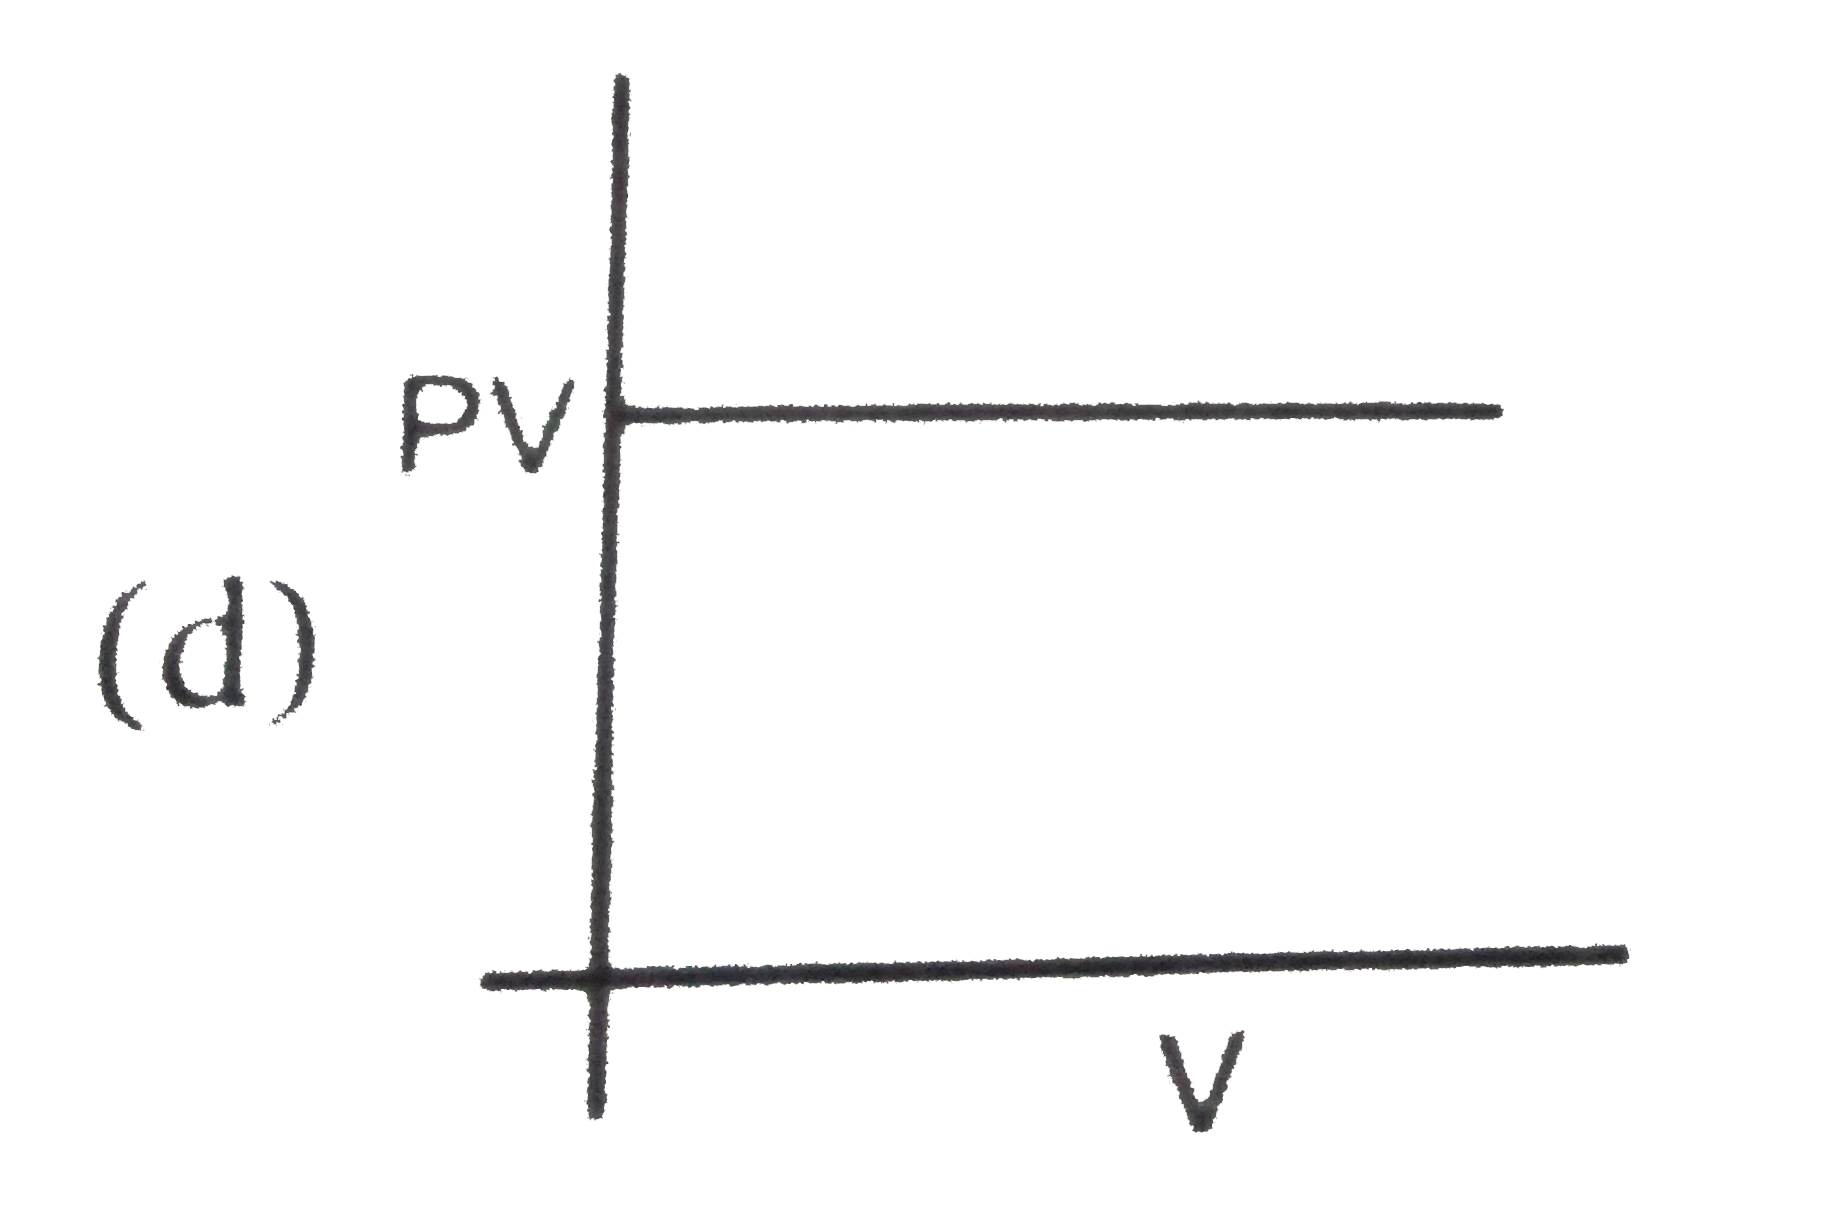
Which of the following curves does not represent Boyle's law?

At constant pressure which of the following does not represent Charle's law?

Which of the following plots does not represent the behaviour of an ideal binary liquid solution?

Graph between pressure and volume are plotted at different temperature. Which of the following isotherms represent Boyle's law as PV = constant?

Graphs between pressure and volume are plotted at different temperatures . Which of the following isotherms represent Boyle's law as PV = constant ? (T_(1) gt T_(2) gt T_(3))

Which of the following curves represent(s) Boyle's law?