Which curve in figure represents the curve of ideal gas ?
According to Charles's law, volume of gas is related to pressure as ..........
The given curve represents the variation of temperature as a function of volume for one mole of an ideal gas. Which of the following curves best represents the variation of pressure as a function of volume?
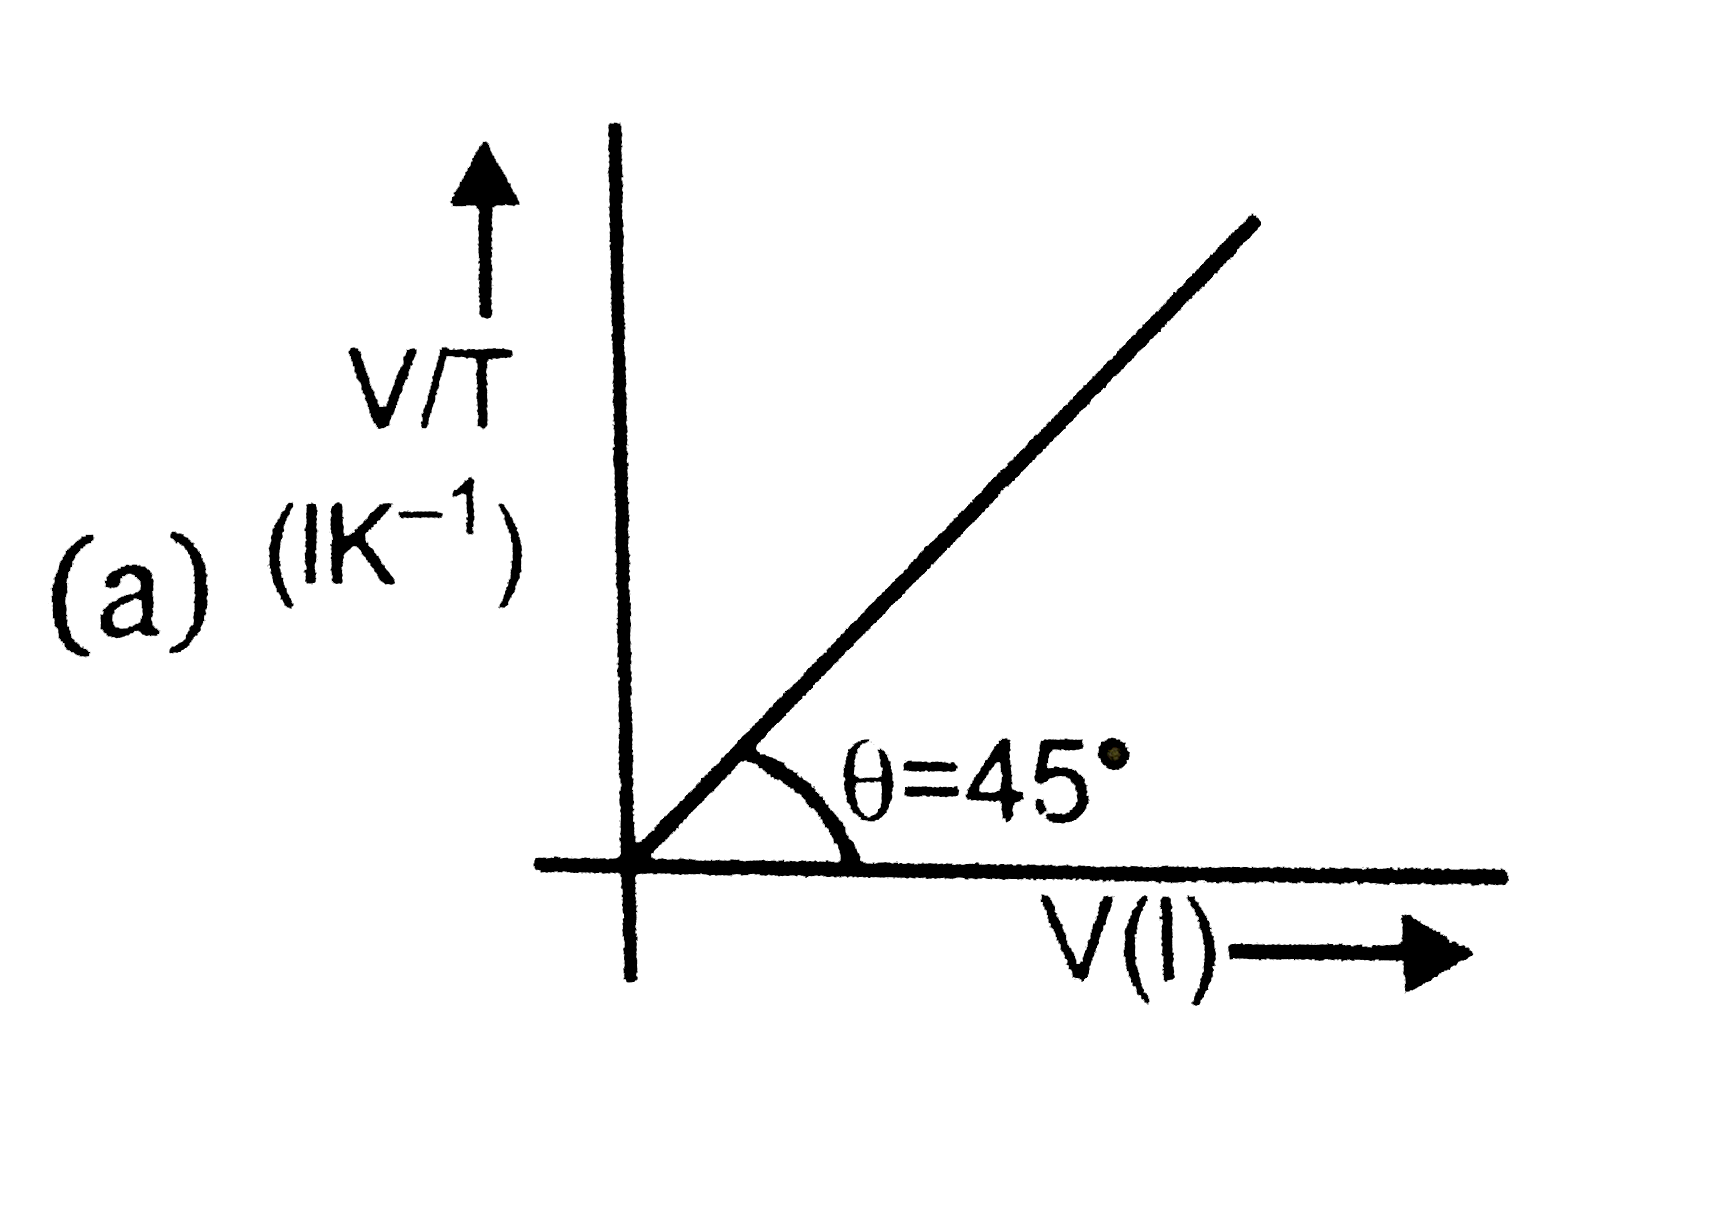
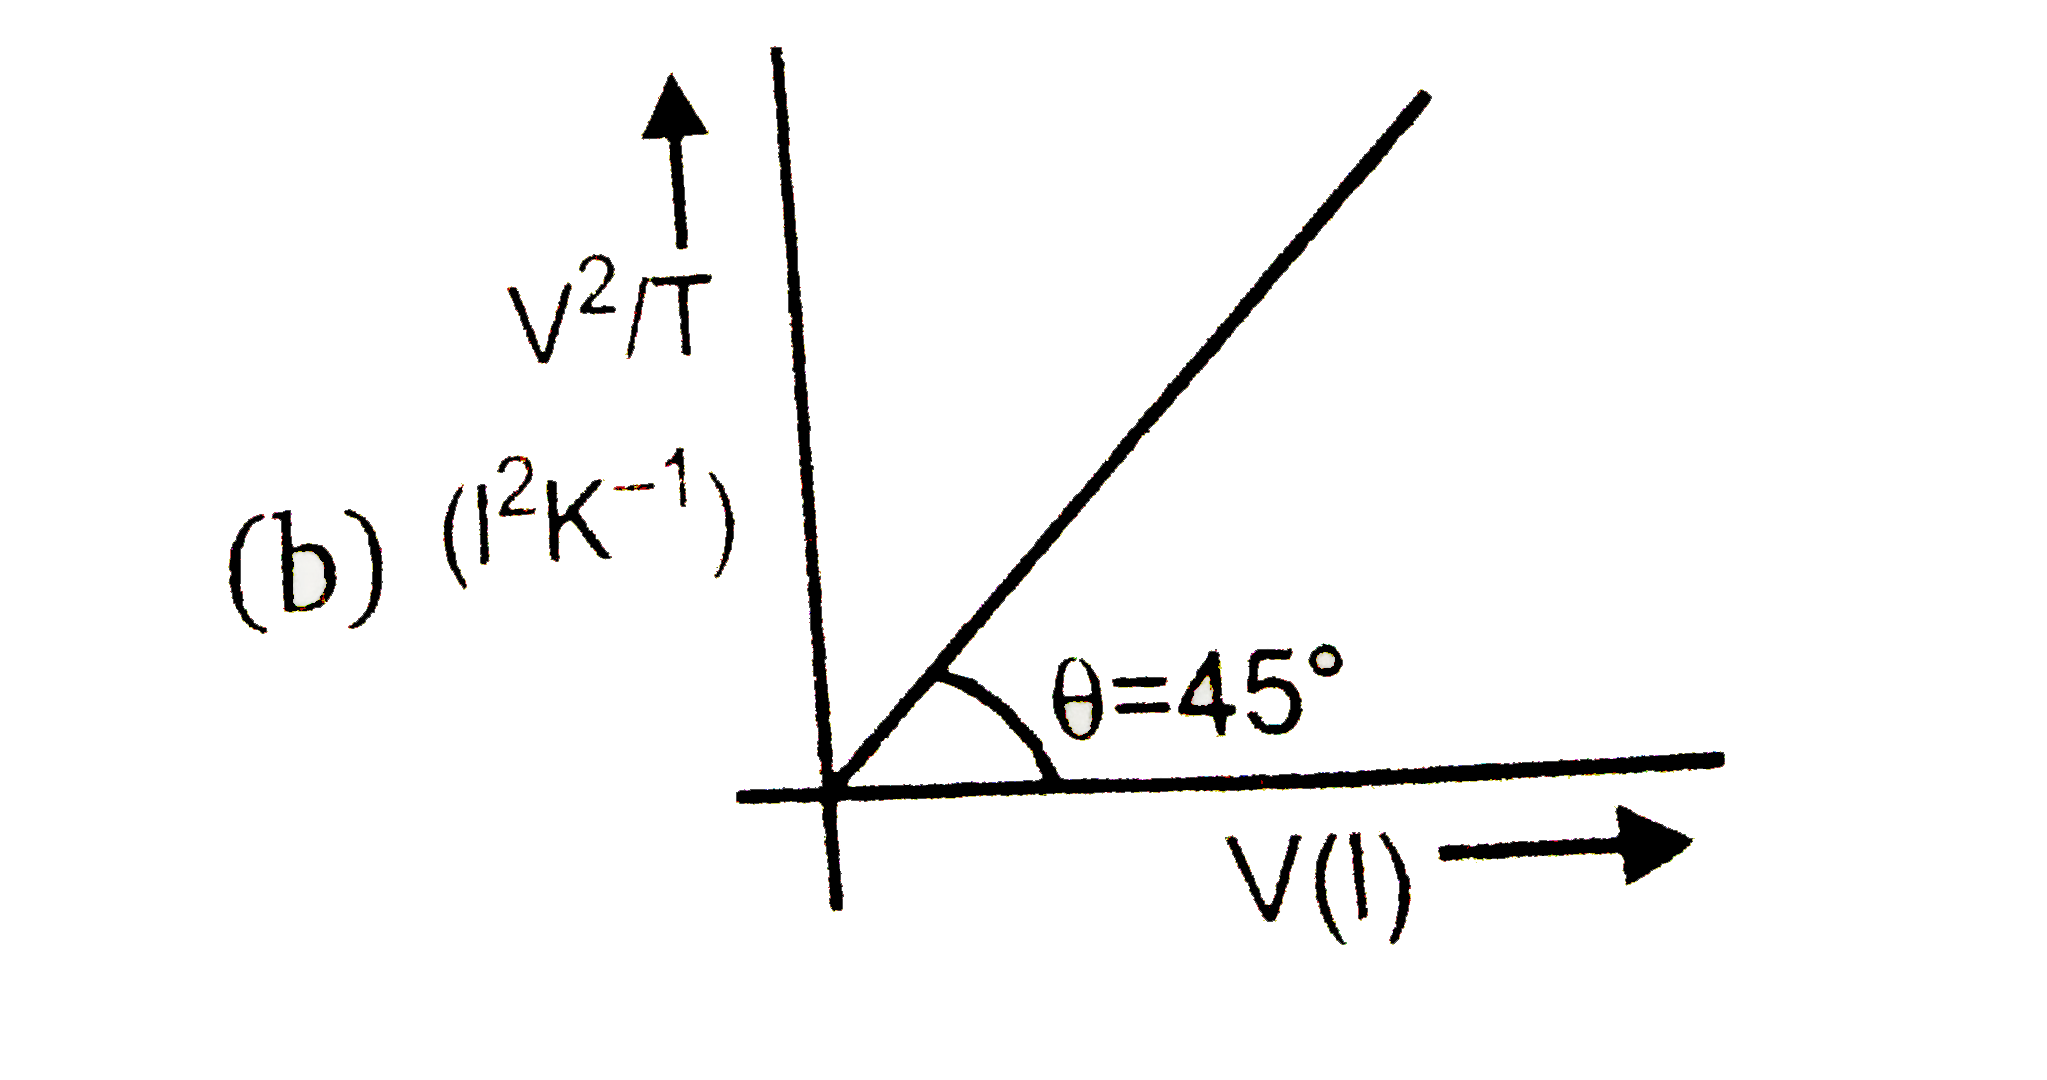
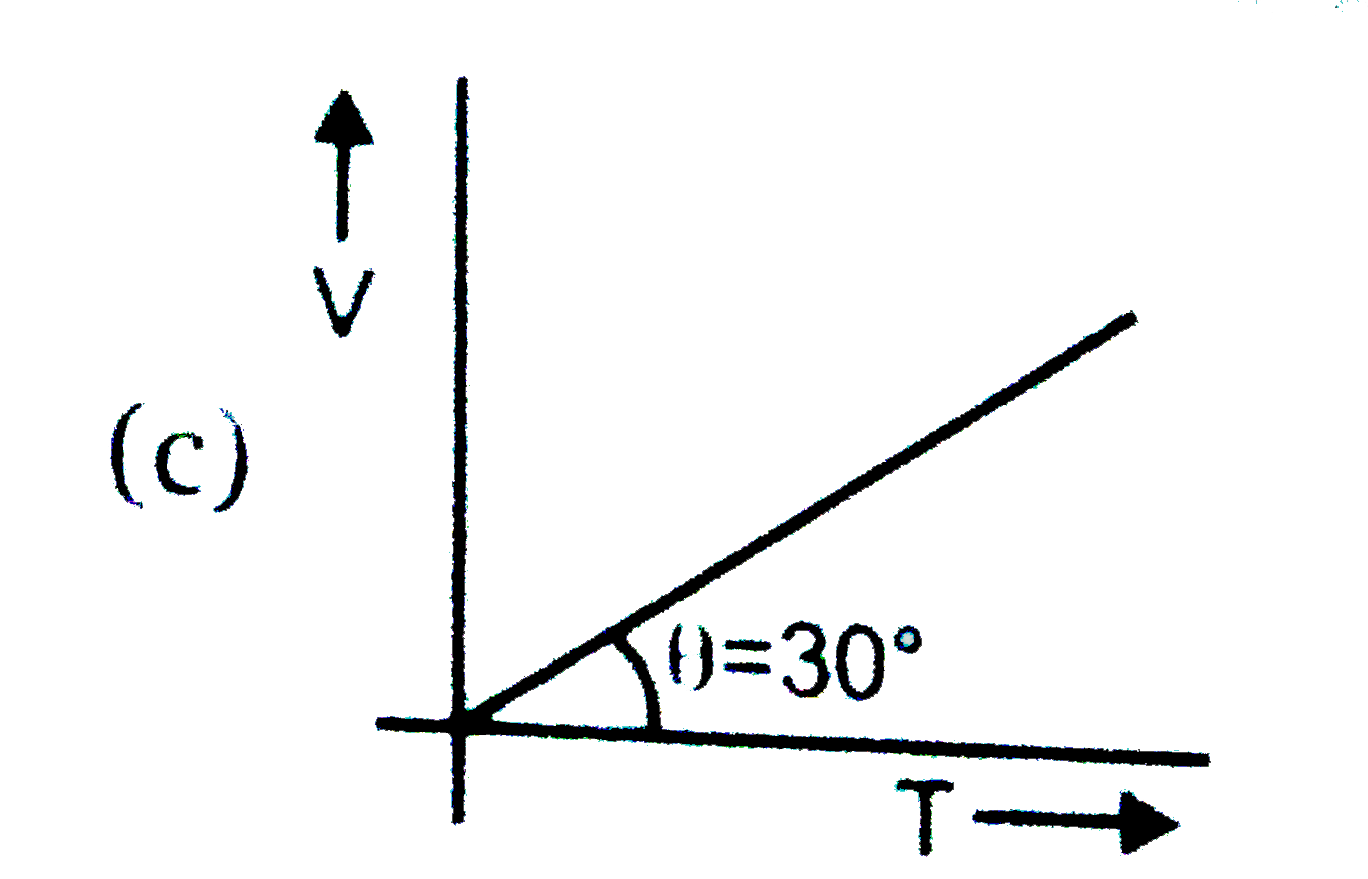
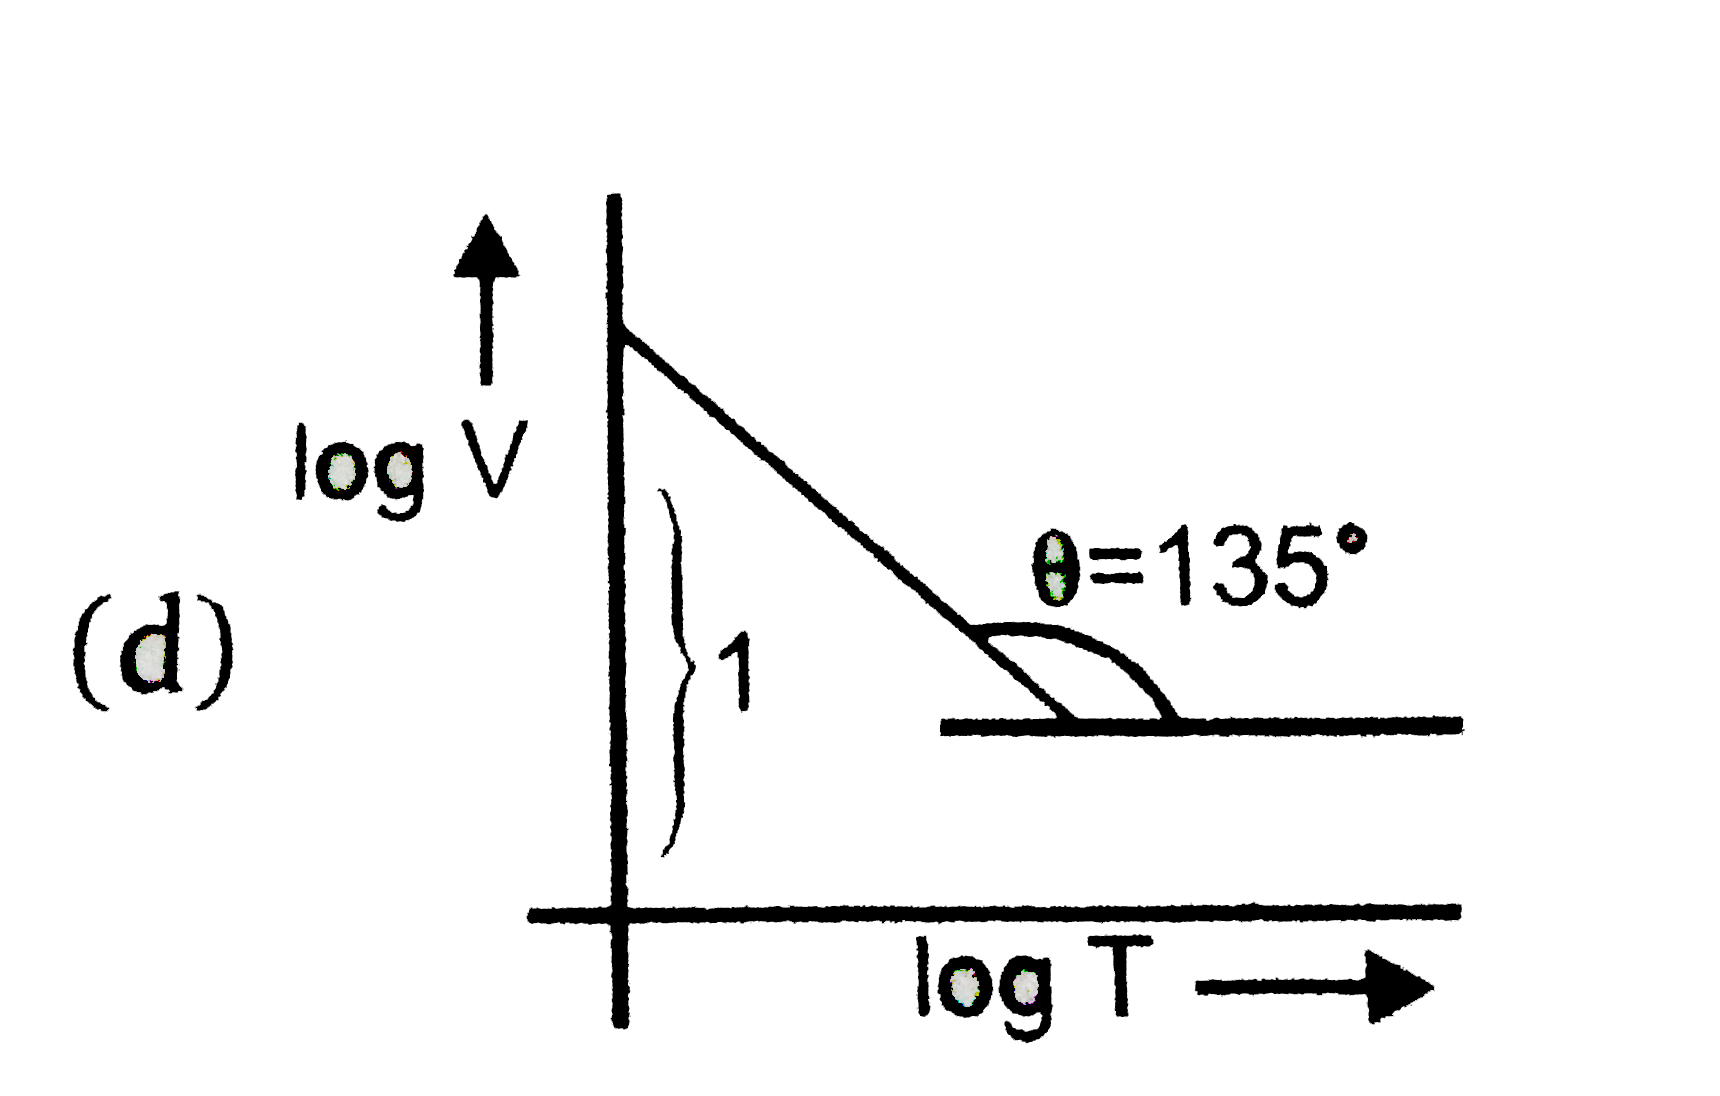
Which of the following plots are correct for an ideal gas ?