For V versus T curves at constant pressure P_1 and P_2 for and ideal gas shown in figure-
V vs T curves at constant pressure P_(1) and P_(2) for an ideal gas are shown below Which is correct ?
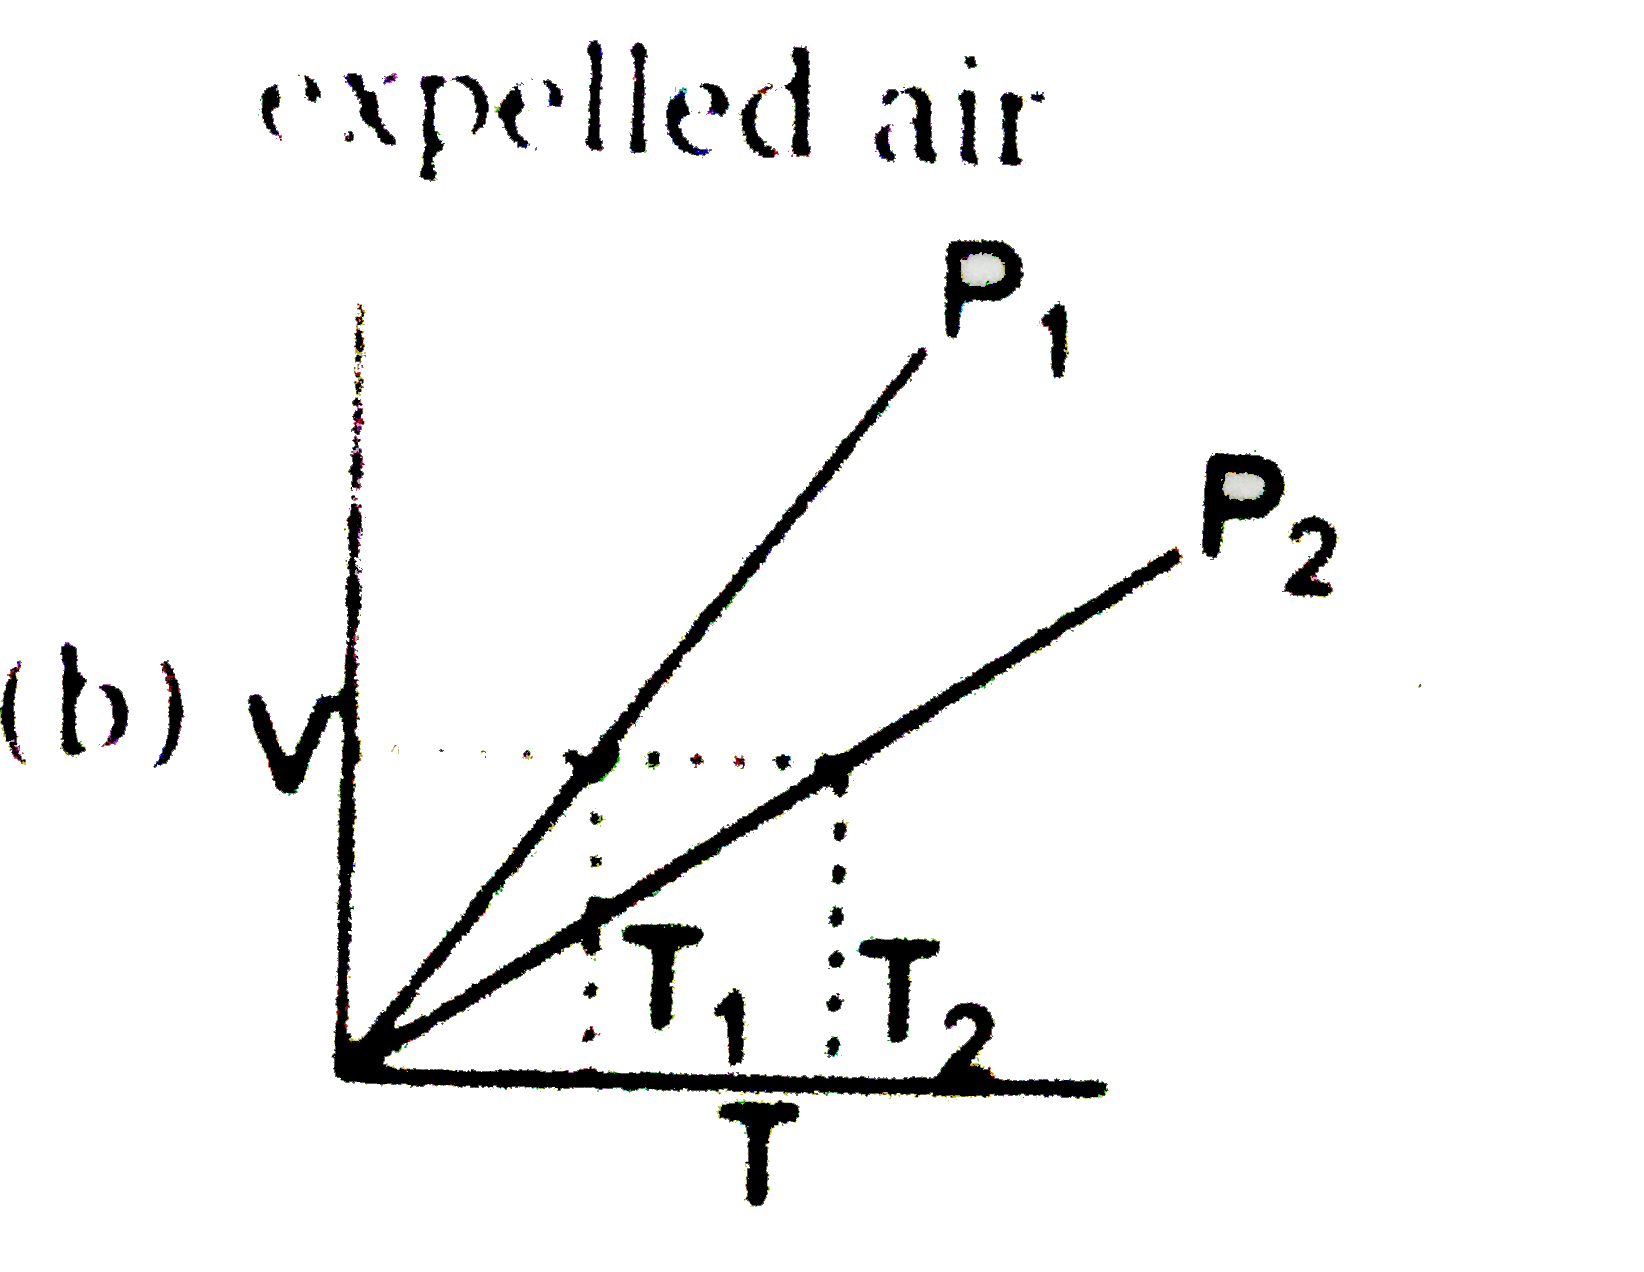
The volume V versus temperature T graphs for a cetain amount of a perfect gas at two pressure p_1 and p_2 are as shown in Fig. It follows from the graphs that p_1 is greater than p_2.
For one mole of an ideal gas the slope of V versus T curve at constant pressure of 2 atm is X lit mol^(-1) K^(-1) . The value of the ideal universal gas constant 'R' in terms of X is "___________" .
V vs T curves at different pressures P_(1) and P_(2) for an ideal gas are shown below: Which one of the following is correct?
1 mole of an ideal gas in a cylindrical container have the P-V diagram as shown in figure.If V_(2)=4V_(1) then the ratio of temperatures (T_(1))/(T_(2)) will be
A gas expands under constant pressure P from volume V_(1) to V_(2) The work done by the gas is
What will be the work done on an ideal gas enclosed in a cylinder, when it is compressed by a constant external pressure p_(ext) , in a single step as shown in figure? Explain graphically.
The pressure and volume of an ideal gas are related as p alpha 1/v^2 for process A rarrB as shown in figure . The pressure and volume at A are 3p_0 and v_0 respectively and pressure B is p_0 the work done in the process ArarrB is found to be [x-sqrt(3)]p_0v_0 find
_E01_061_Q01.png)