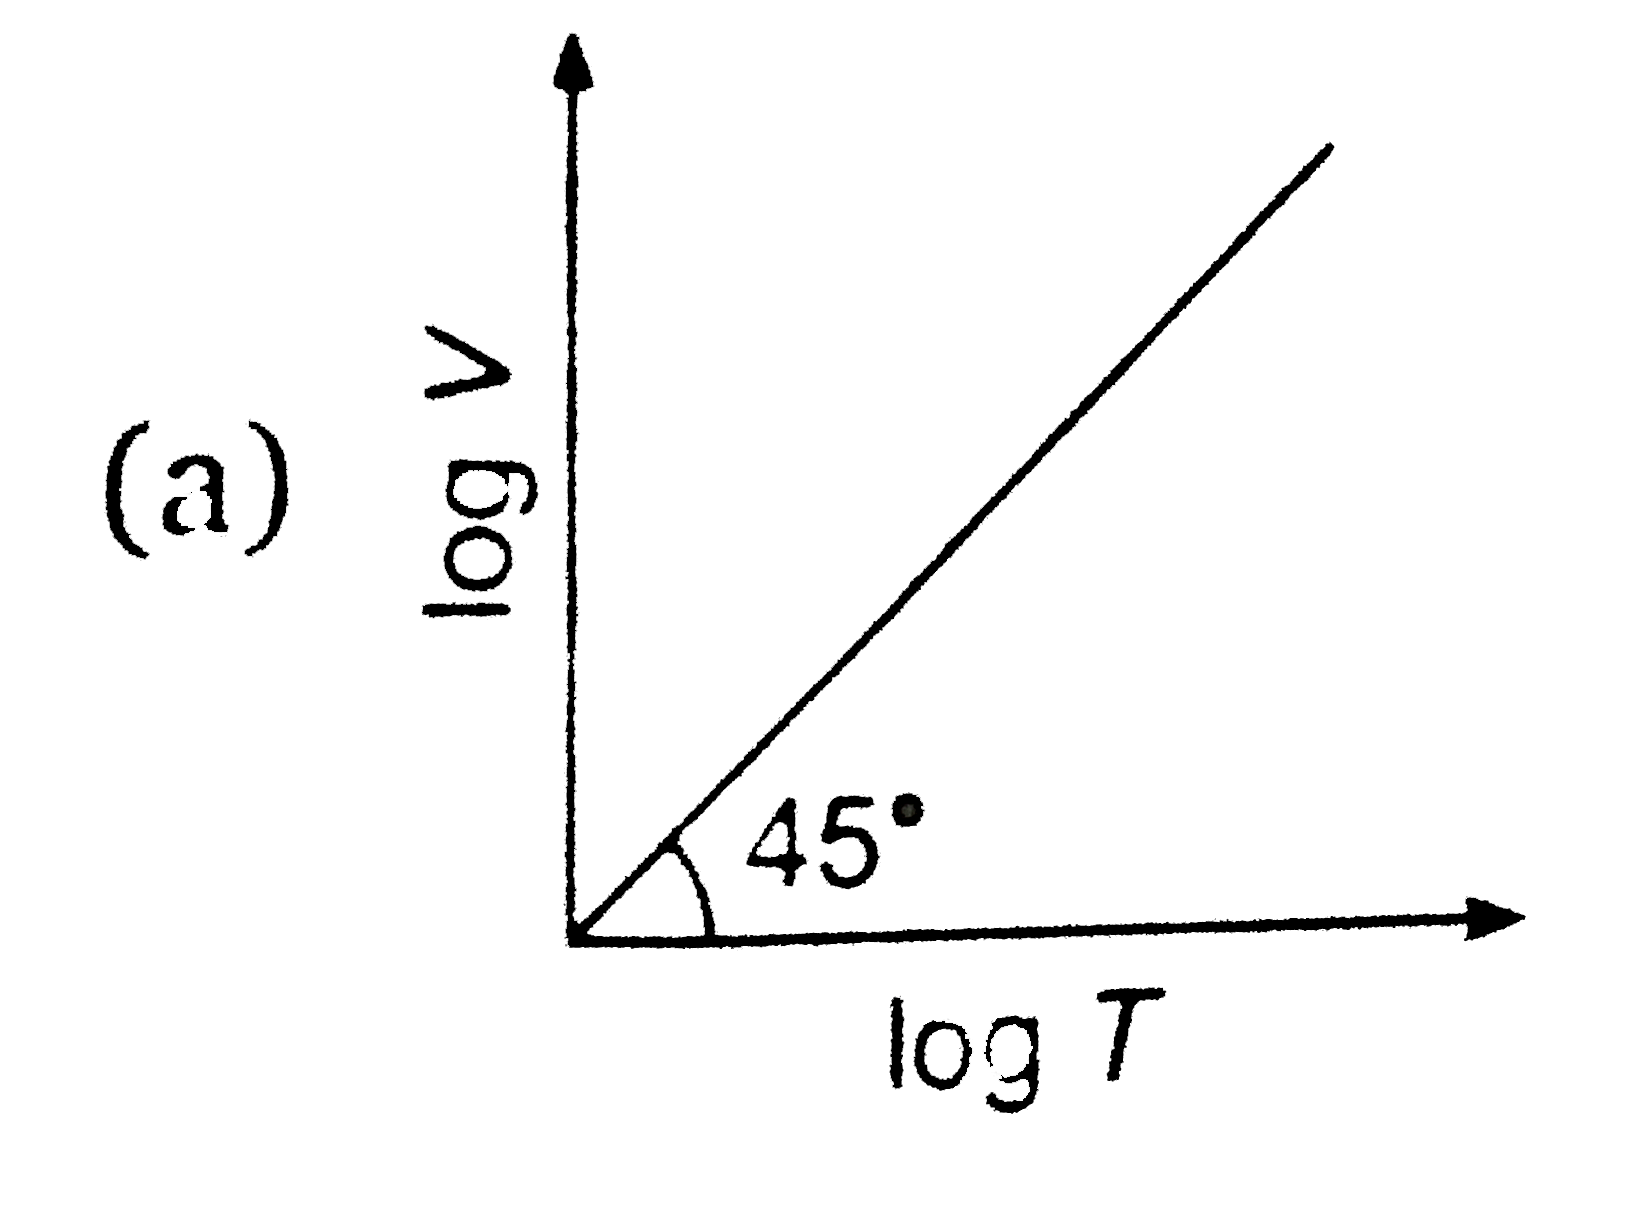
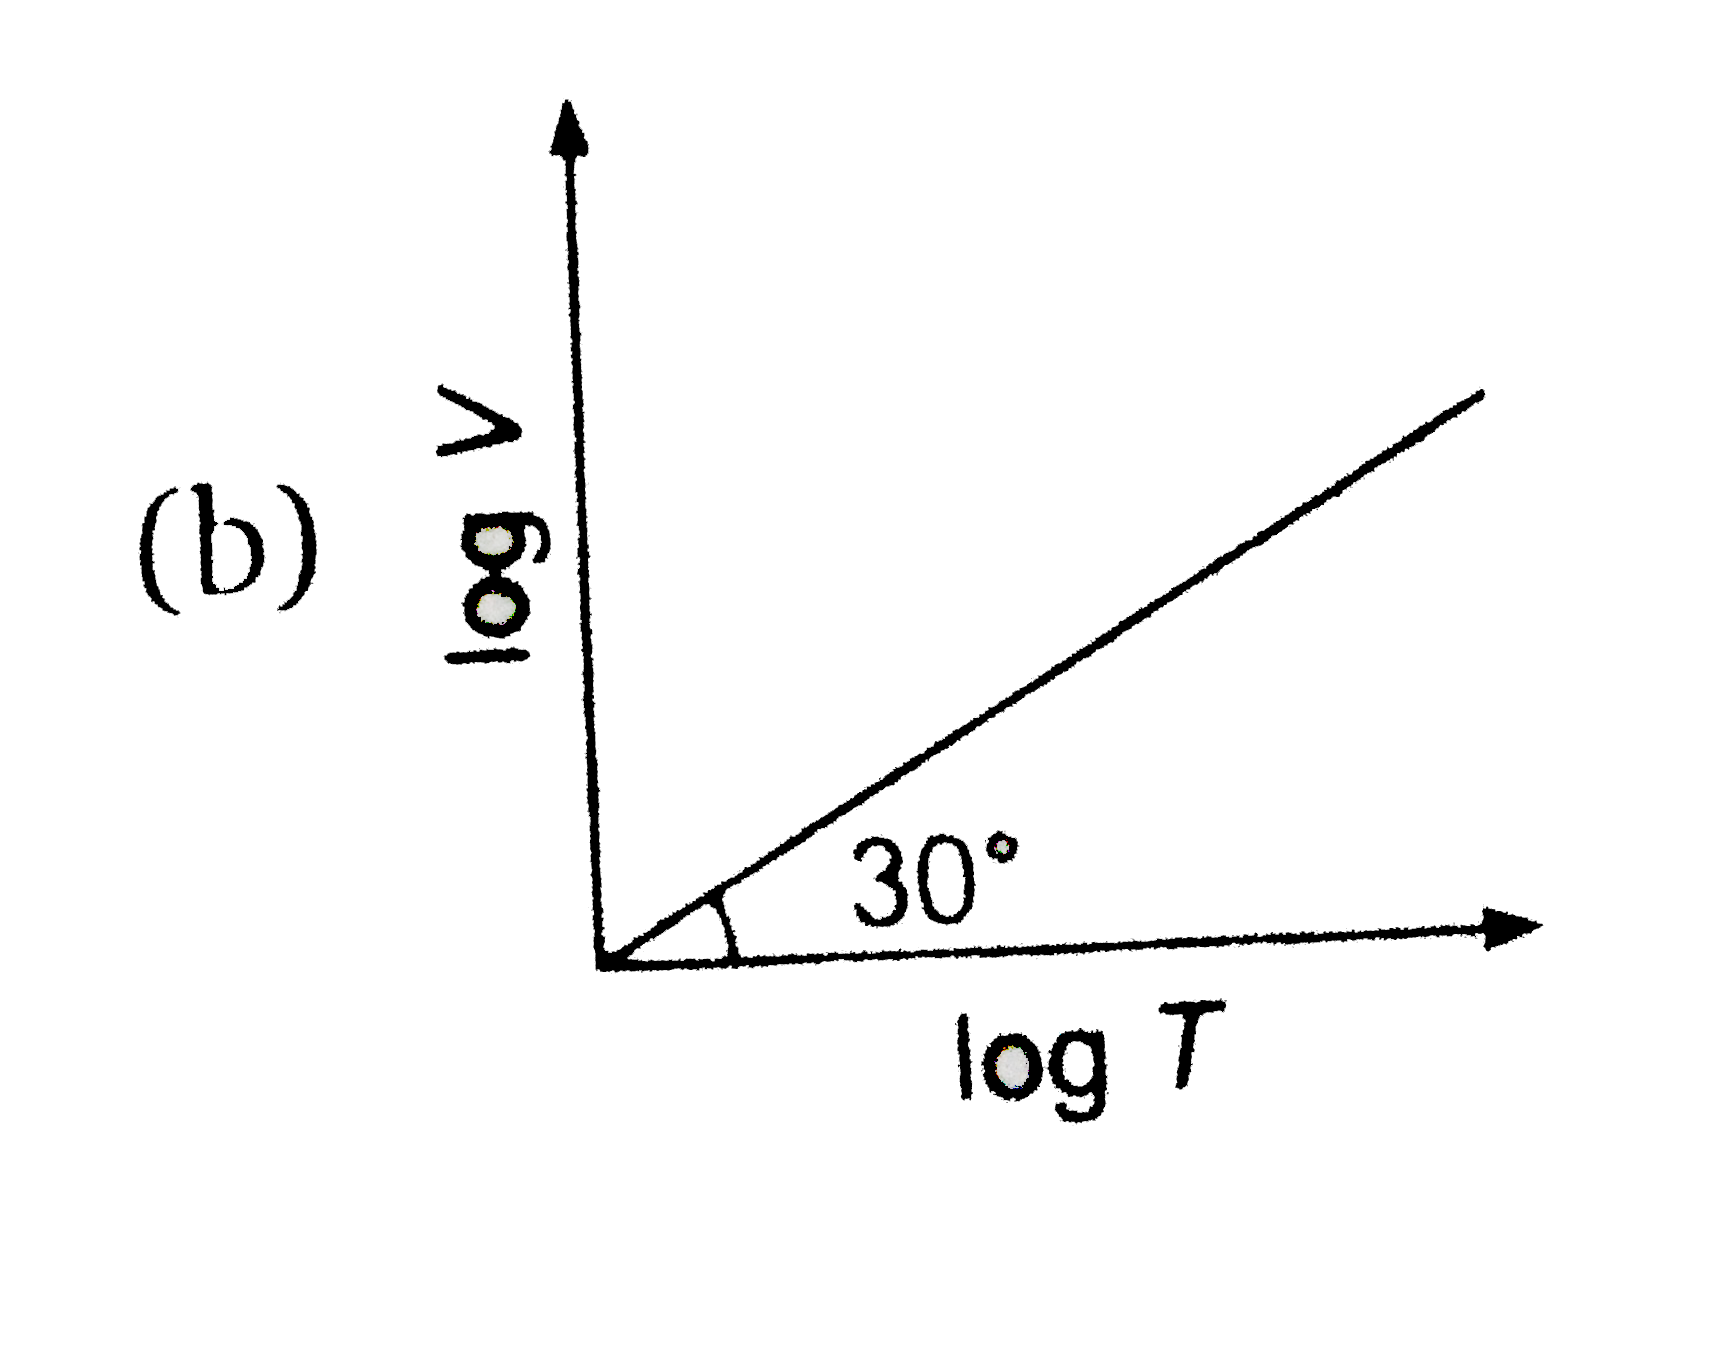
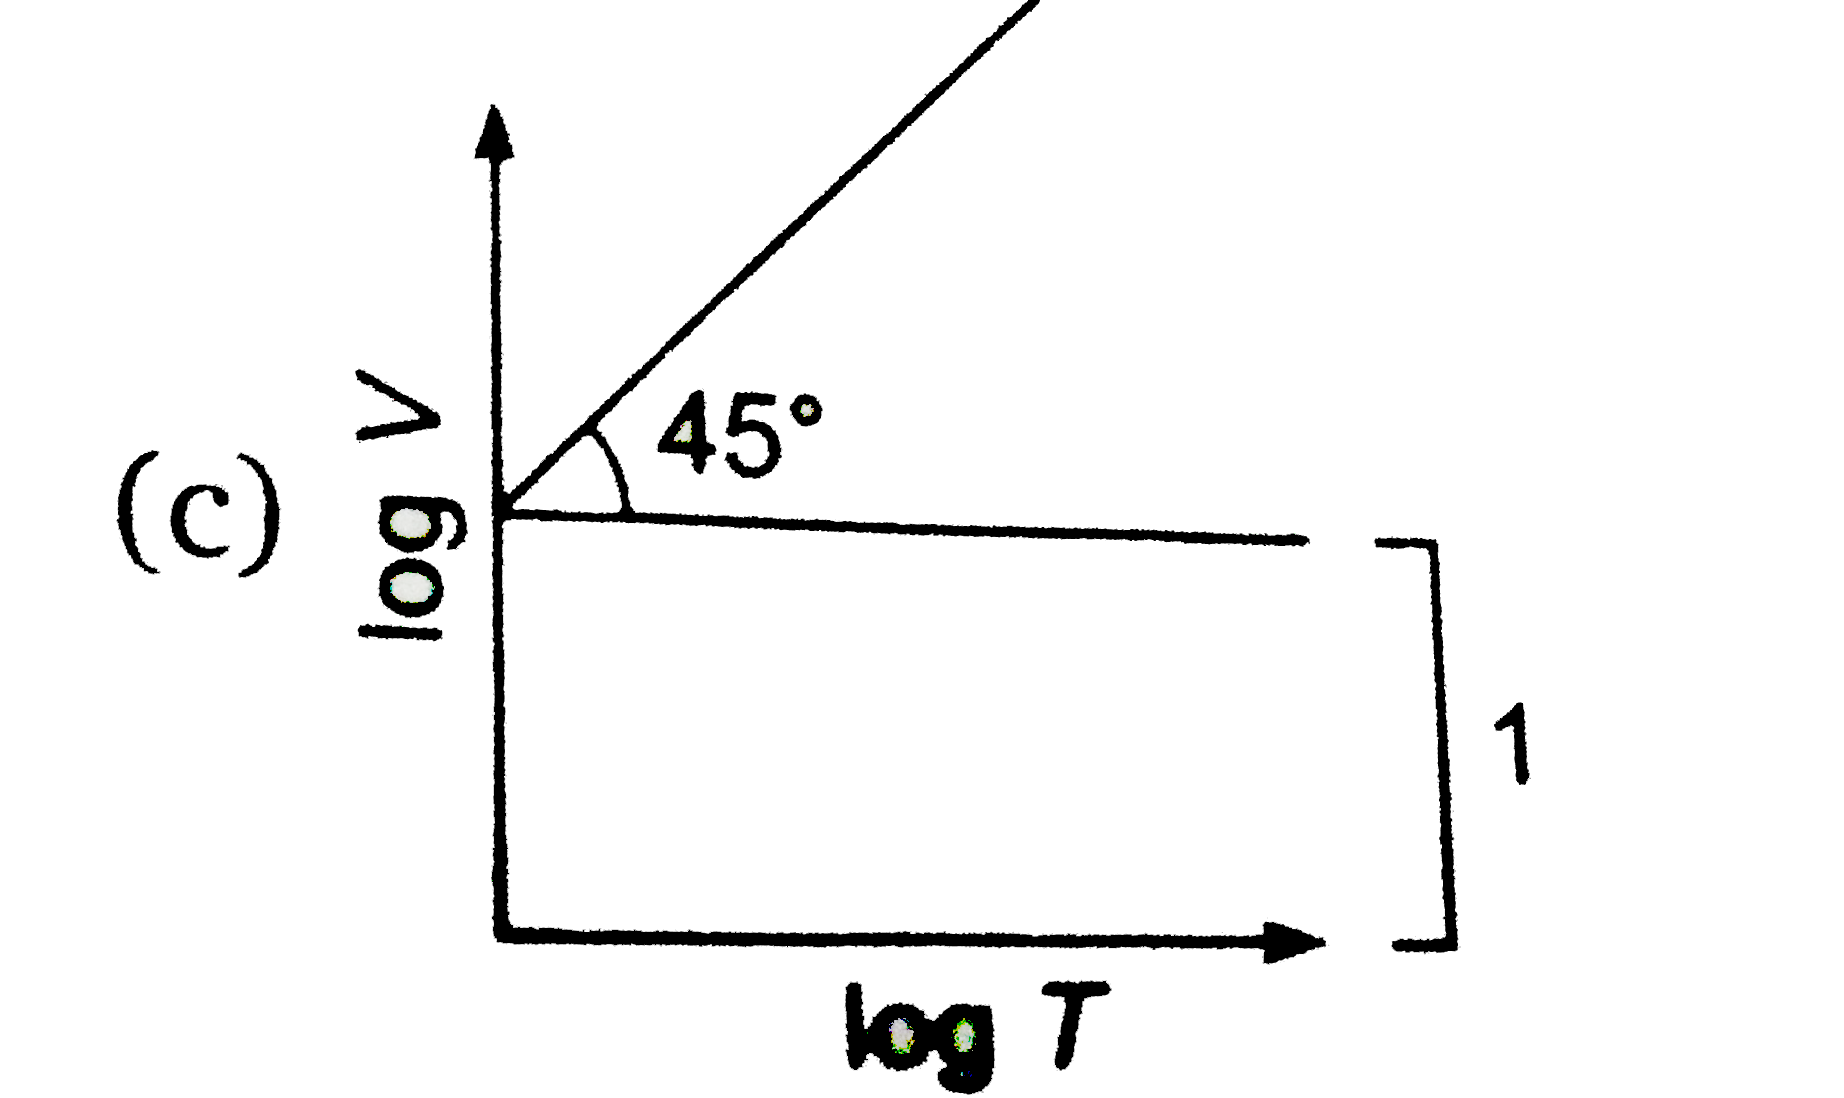
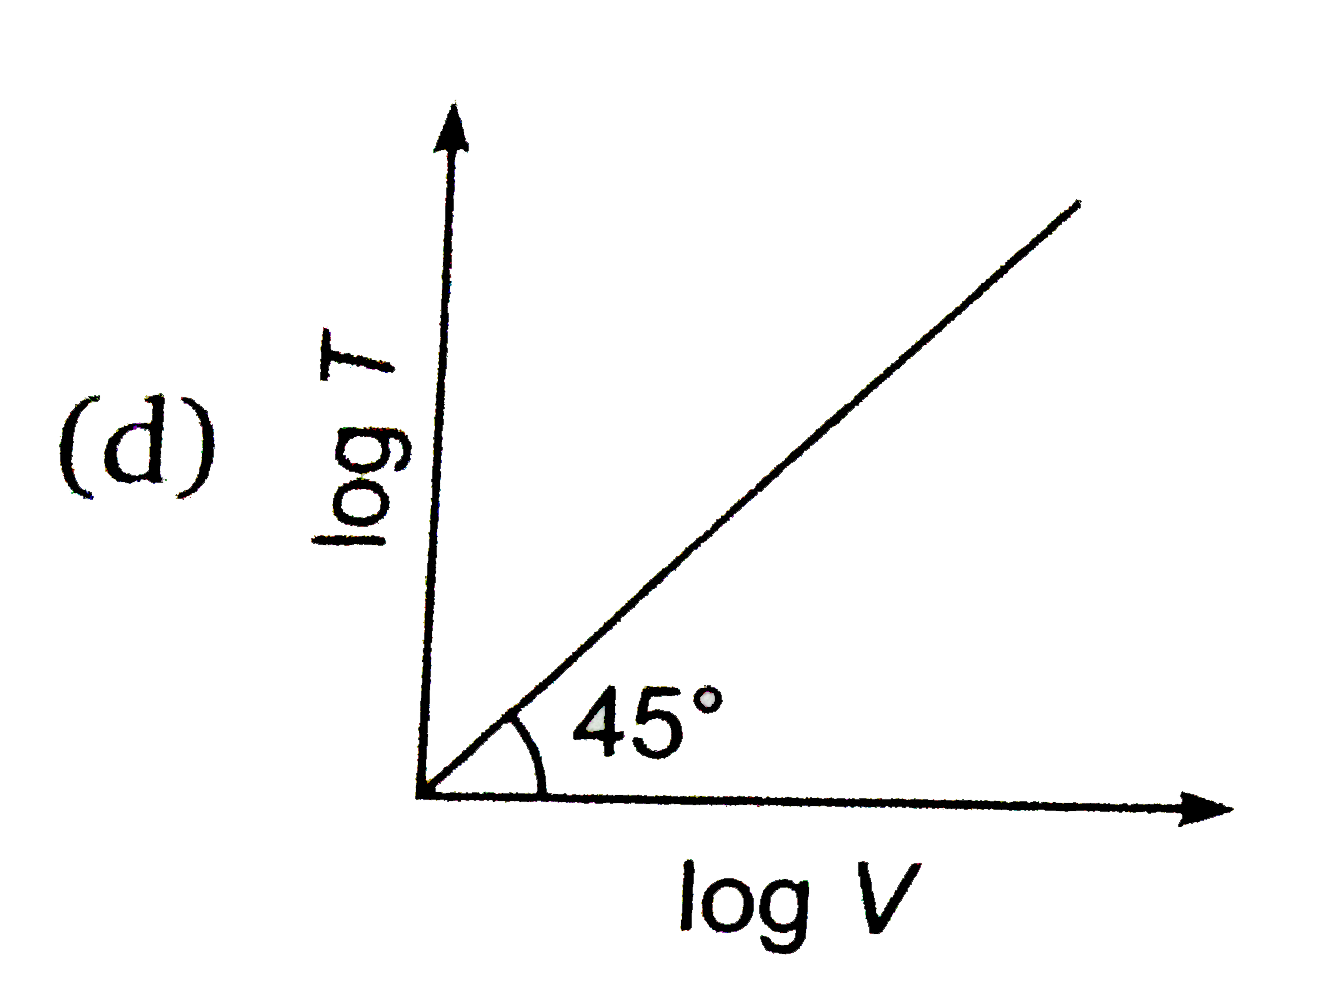
For a closed container containing 10 moles of an ideal gas, at constant pressure of `0.82` atm, which graph correctly represent, variation of log V us log T where volume is in litre and temp. in kelvin :
For a closed container containing 100 mol of an ideal gas fitted with movable, frictionless, weightless piston operating such that pressure of gas remain constant at 8.21 atm, which graph repsents correct variation of log V v//s log T where V is in litre and T is in Kelvin ? (R = 0.0821 (atmL)/(molK))
If heat energy is given to an ideal gas at constant pressure, then select the graph which best represents the variation of VT with temperature (T).
Ten moles of an ideal gas are filled in a closed vessel. The vessel has cylinder and piston type arrangement and pressure of the gas remains constant at 0.821 atm. Which of the following graph represents correct variation of log V vs log T? (V = Volume in litre and T = temperature in Kelvin)
A container contains 1 mole of a gas at 1 atm pressure and 27° C, while its volume is 24.6 litres. If its pressure is 10 atm and temperature 327° C, then new volume is
At a constant pressure, of the following graphs that one which represents the variation of the density of an ideal gas with the absolute temperature T, is