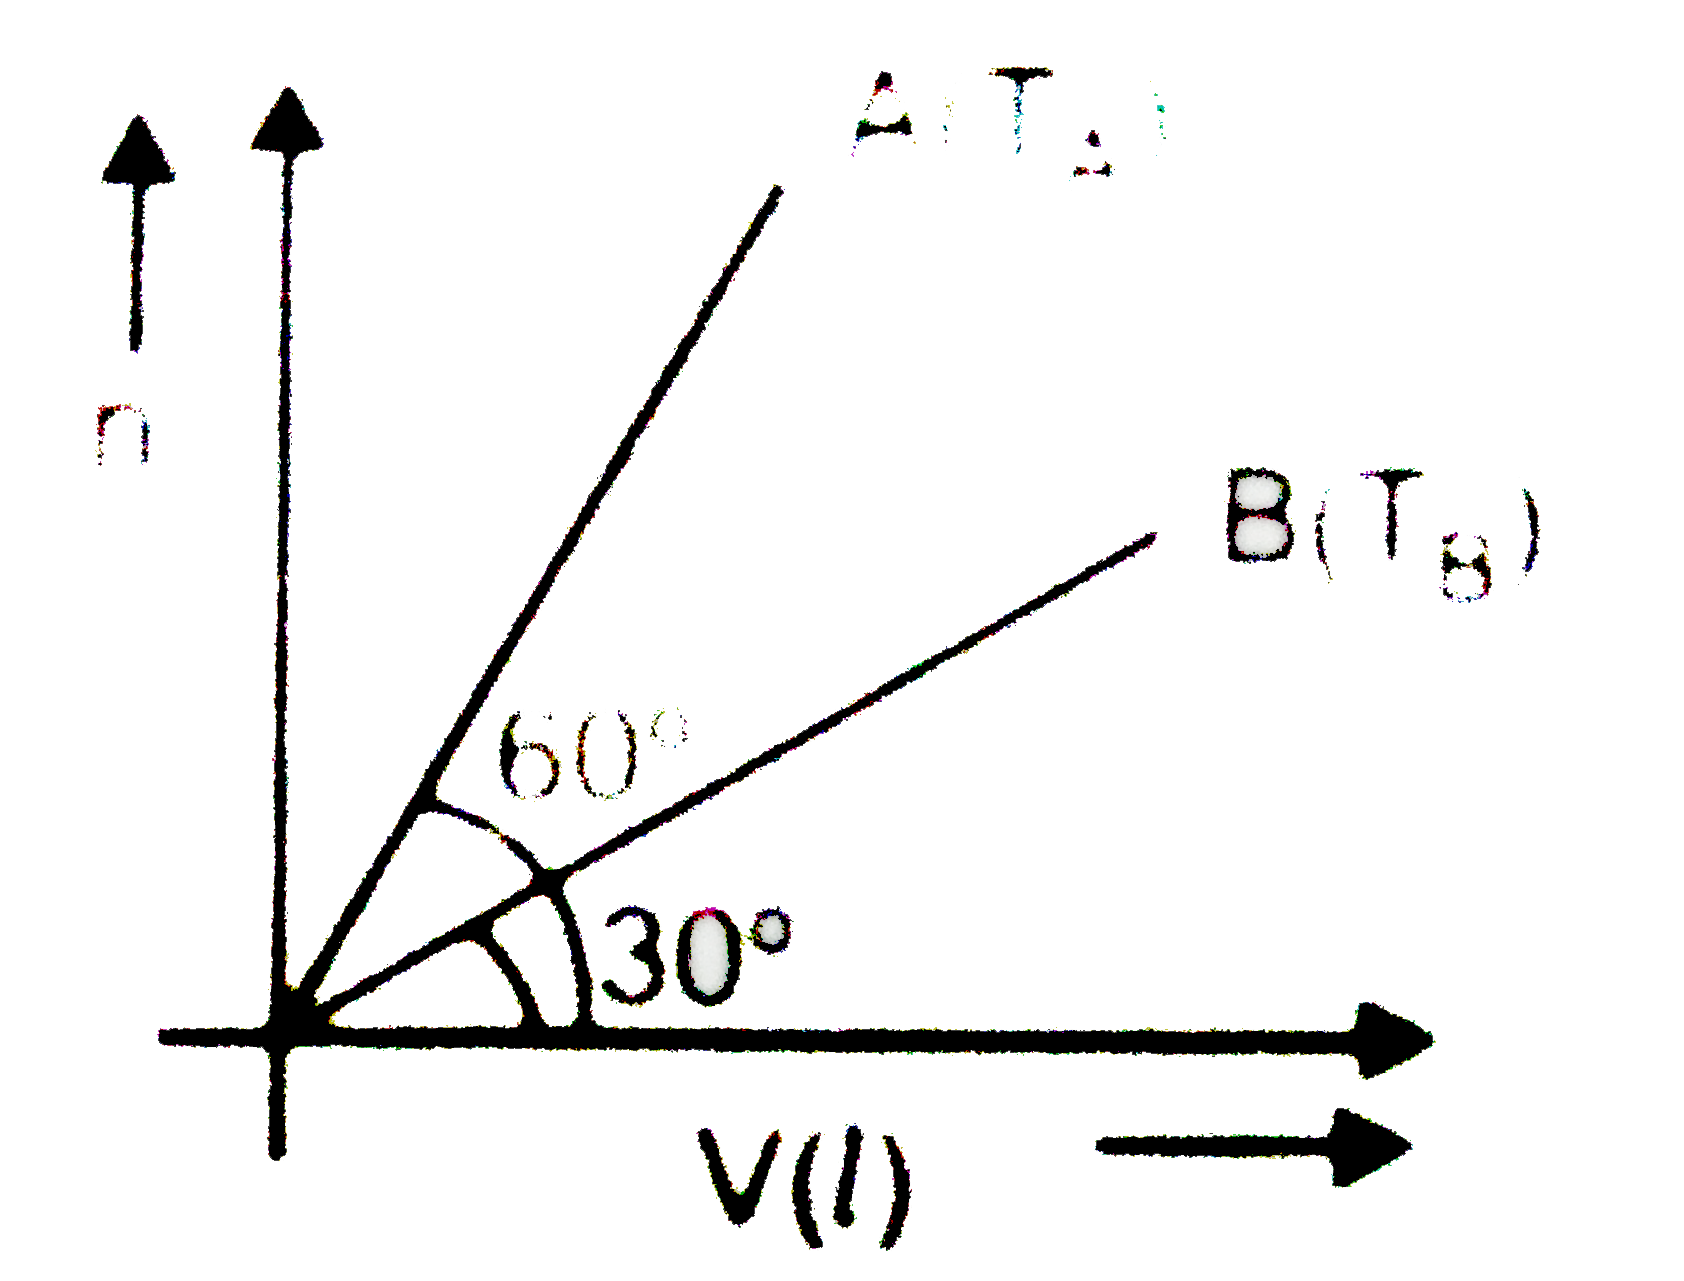
For two samples of ideal gases A and B curves are plotted n vs V (volume of container ) at 16.42 atm pressure. Then temperature of A and B respectively are:
A
`(200)/(sqrt(3))K,200sqrt(3) K`
B
`(200)/(sqrt(3))@_(C),(200sqrt(3))^(@)C`
C
`200sqrt(3)K,(200)/(sqrt(3))K`
D
`200K,(sqrt(3))/(200)K`
Text Solution
Verified by Experts
The correct Answer is:
a
(a) `n=((P)/(RT))V` Slope of line `=(P)/(RT)=tantheta` `implies" "T=(P)/(Rtantheta)=(16.42)/(0.0821tantheta)` For B, `T=200sqrt(3)K` For A, `T=(200)/(sqrt(3))K`
Topper's Solved these Questions
GASEOUS STATE
NARENDRA AWASTHI|Exercise Level 1 (Q.31 To Q.60)|1 Videos
GASEOUS STATE
NARENDRA AWASTHI|Exercise Level 1 (Q.121 To Q.150)|1 Videos
Two gases A and B having the same pressure P, volume V and temperature T are mixed. If mixture has volume and temperature as V and T respectively, then the pressure of the mixture will be
A closed vessel A having volume V contains N_(2) at pressure P and temperature T. another closed vessel B having the same volume V contains. He at the same pressure P. but temperature 2T. The ratio of masses of N_(2) and He in the vesses A and B is
Two samples A and B are initaially kept in the same state. The sample A is expanded through an adiabatic process and the sample B through an isothermal process. The final volumes of the samples are the same . The final pressures in A and B are p_A and P_B respectively.
Two different ideal diatomic gases A and B are initially in the same state. A and B are then expanded to same final volume through adiabatic and isothermal process respectively. If P_(A), P_(B) and T_(A), T_(B) represents the final pressure and temperature of A and B respectively then.
Two identical containers A and B having volume of ideal gas at the same temperature have mass of the gas as m_(A) and m_(B) respectively. 2 m_(A) = 3 m_(B) . The gas in each cylinder expand isothermally to double its volume. If the change in pressure in A is Delta p , find the change in pressure in B :
The volume vs. temperature graph of 1 mole of an ideal gas is given below The pressure of the gas (in atm) at X, Y and Z, respectively, are
Two gases A and B at same pressure contain number of moles n_(1) and n_(2) . Their volume temperature graphs are shown in figure. Then the ratio
A graph is plotted between extent of adsorption vs pressure (P) at constant temperature, the Frendlich equation at points A, B, C respectively are: