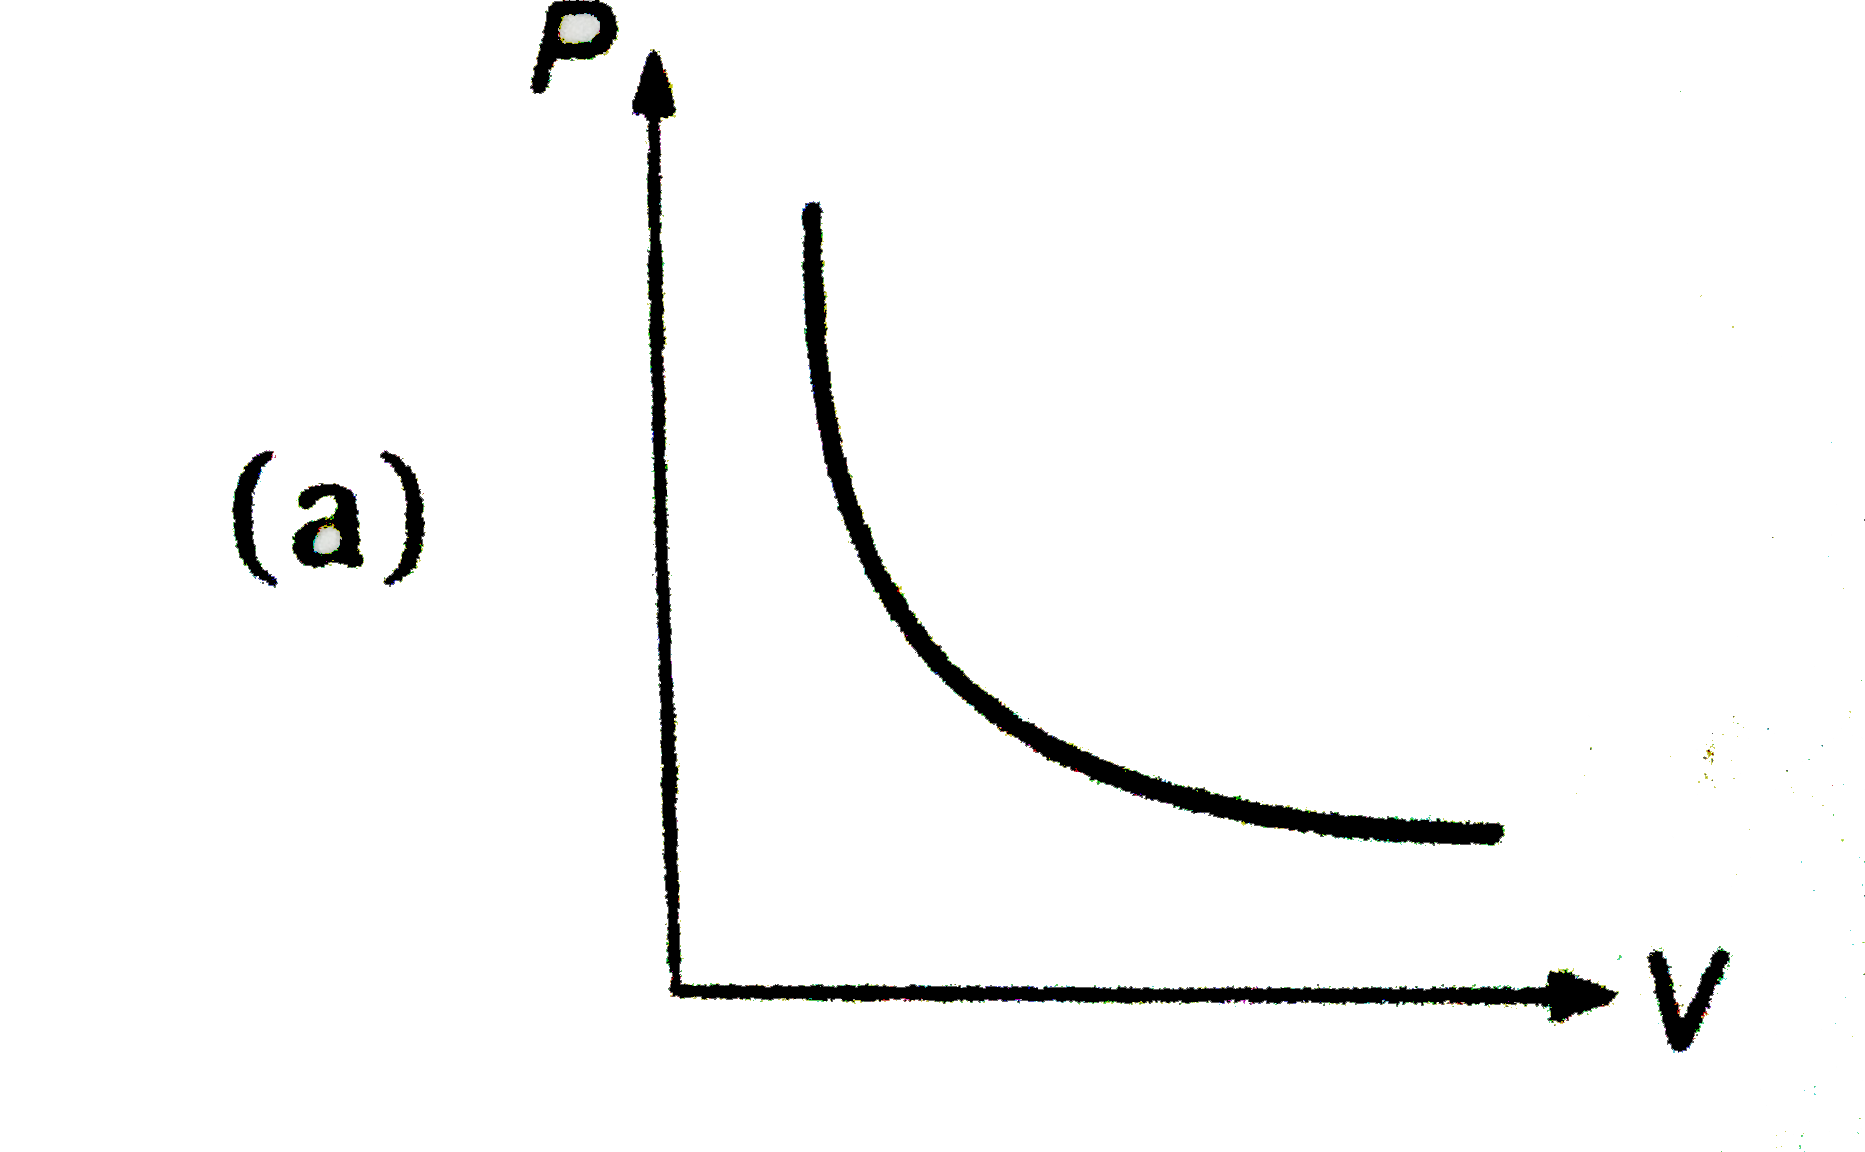
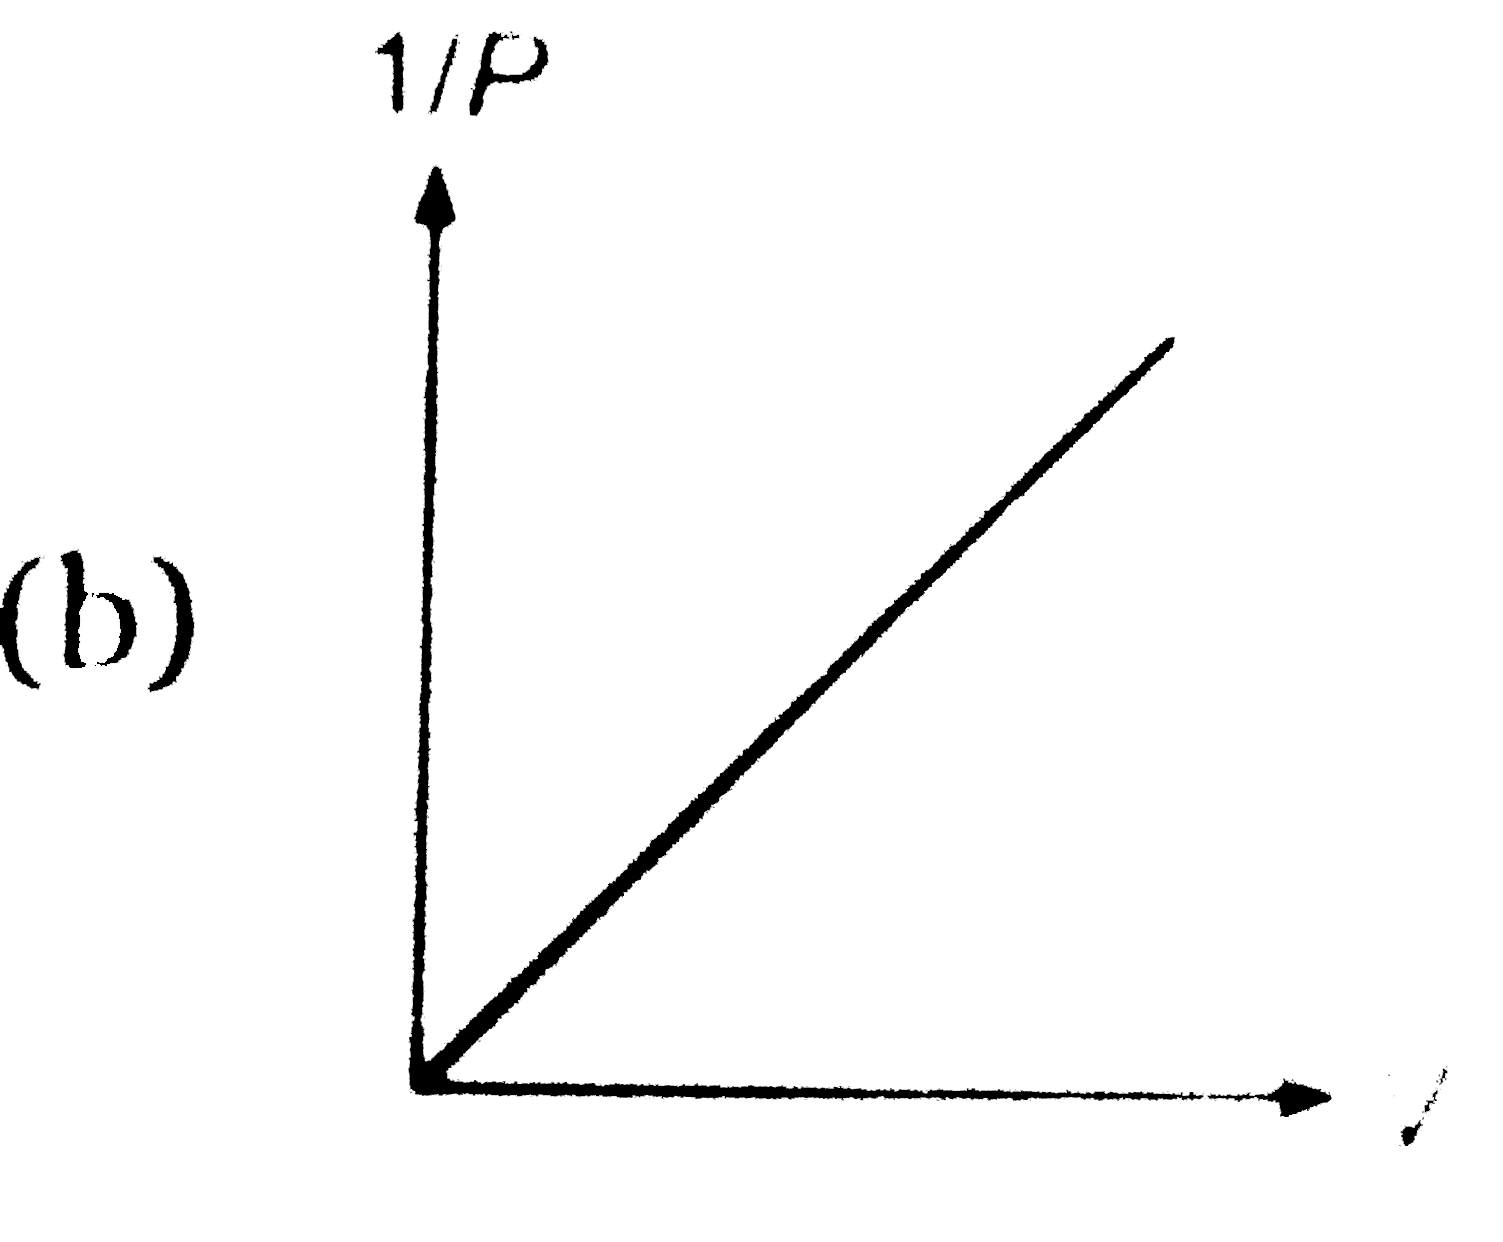
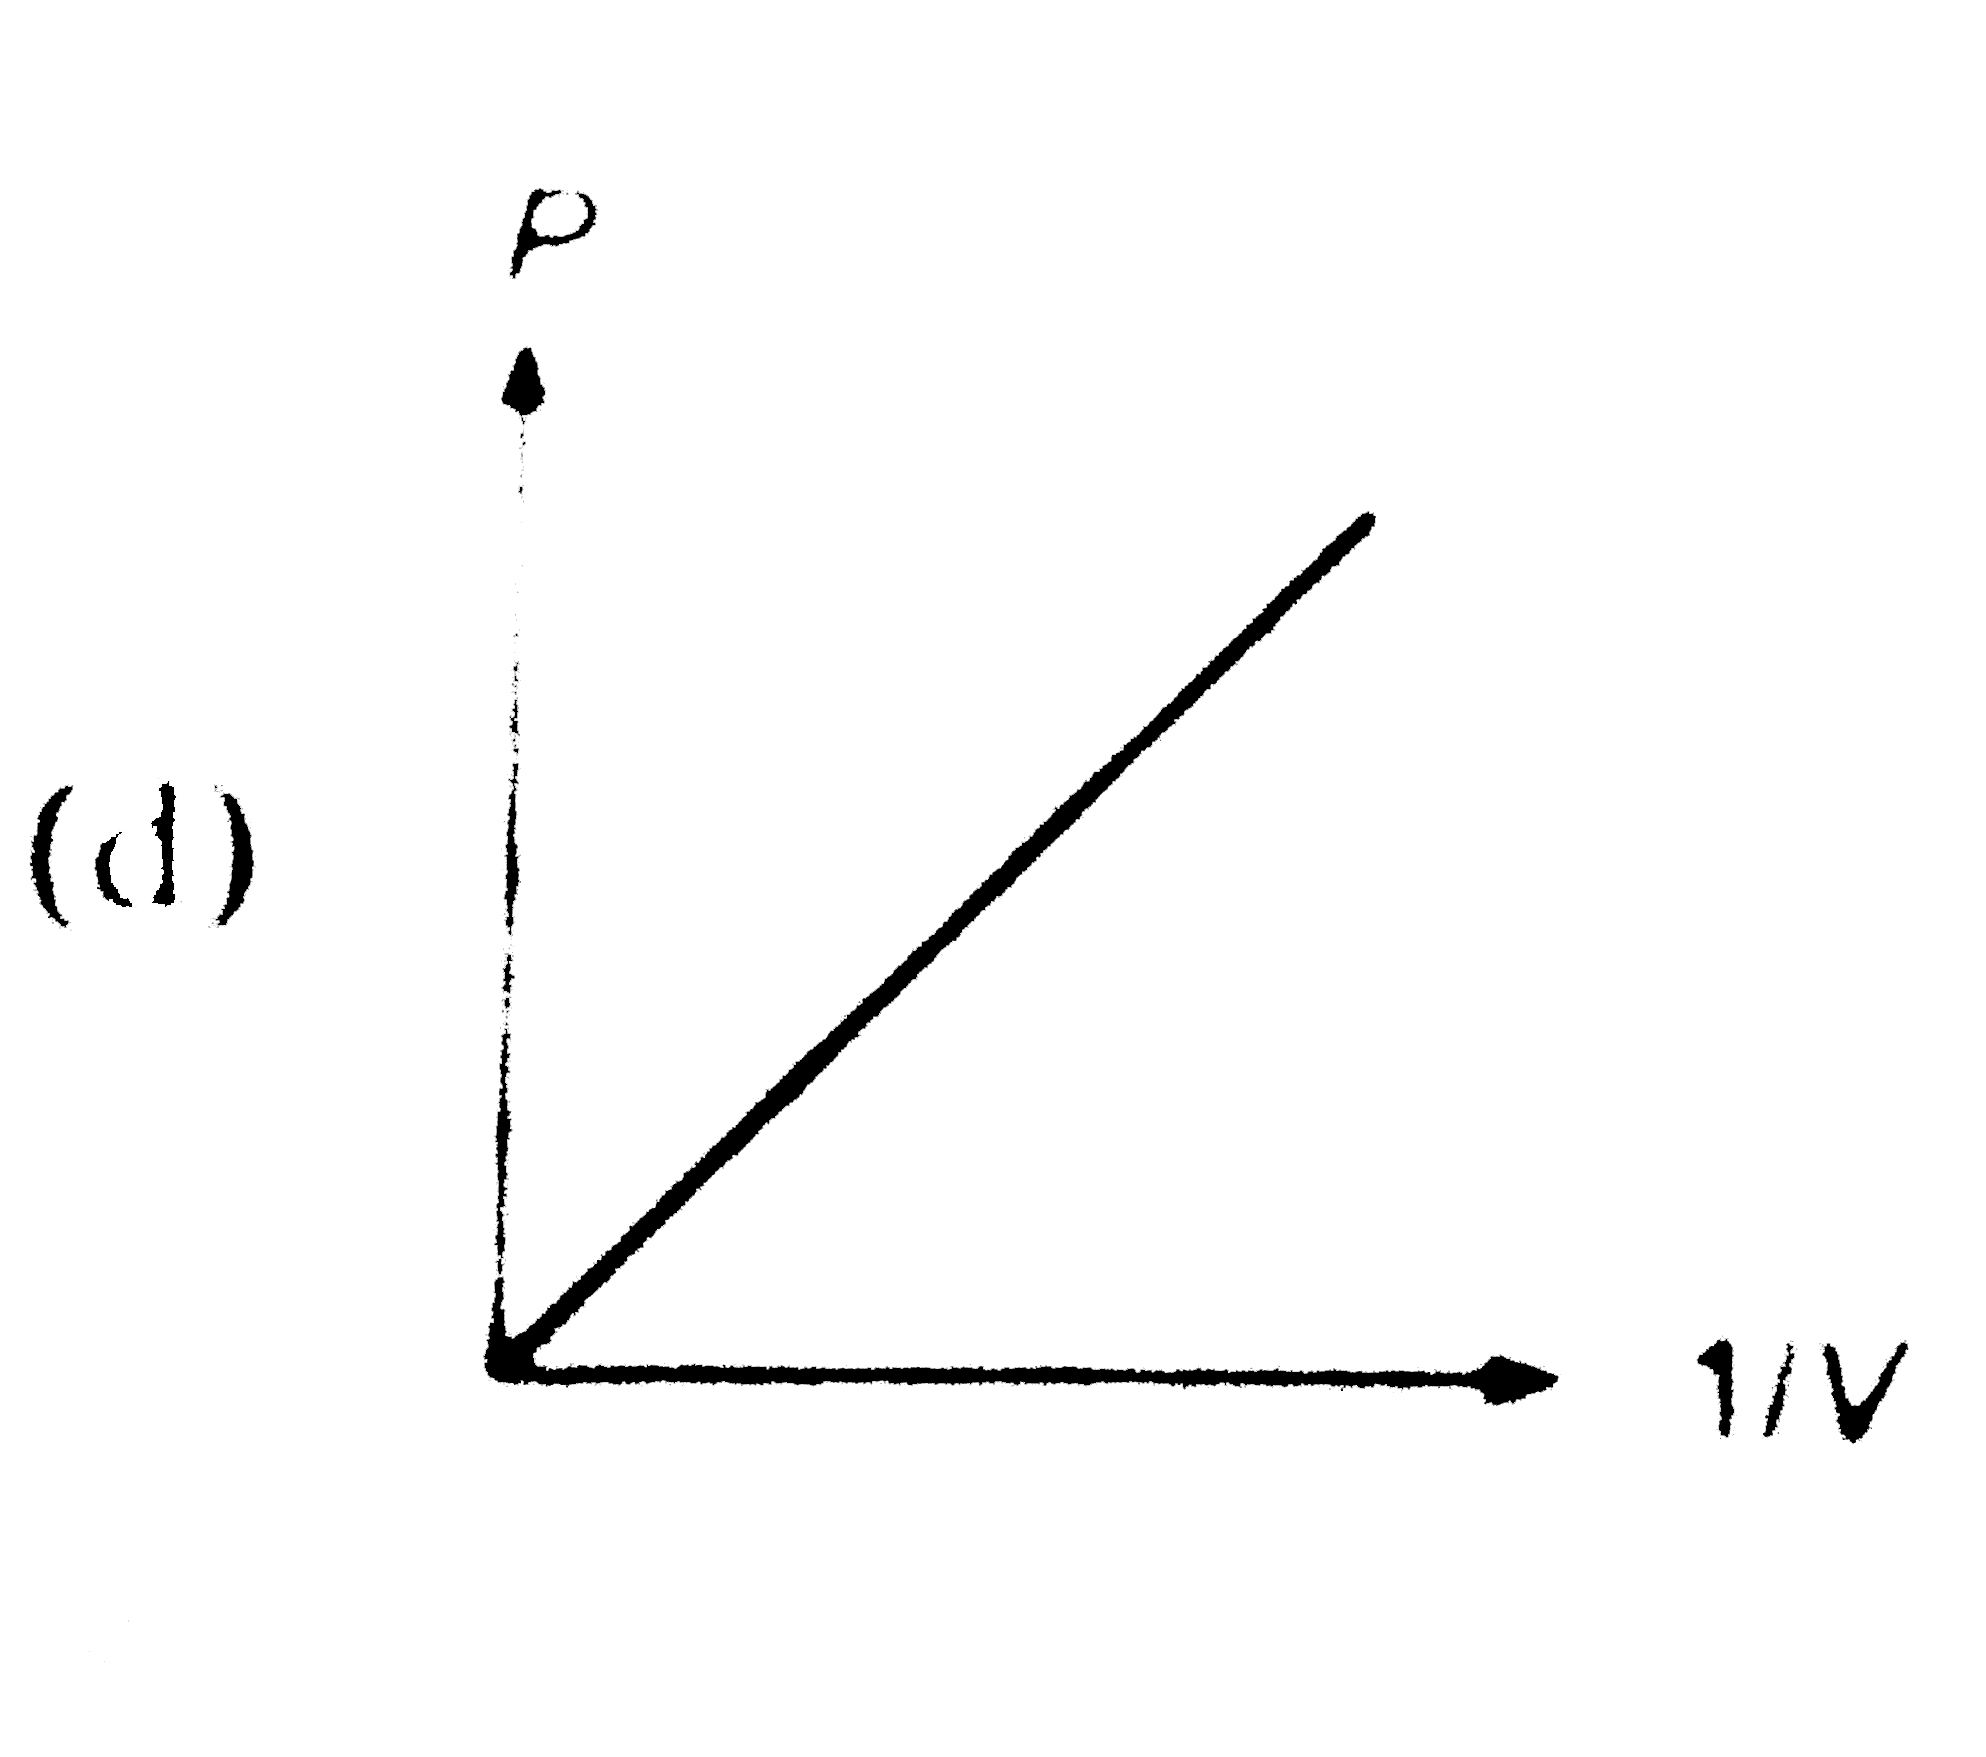
Which of the following graph represents Boyle's law ?
Which of the following graphs represents Boyle's law correctly? (i)
Which of the following graph represent Boyle's law ?
Graph between pressure and volume are plotted at different temperature. Which of the following isotherms represent Boyle's law as PV = constant?
Which of the following curves represents the Henry's law?
Which of the following curves represents the Henry's law ?
Which of the following curves represent the Henry's law
Graphs between pressure and volume are plotted at different temperatures . Which of the following isotherms represent Boyle's law as PV = constant ? (T_(1) gt T_(2) gt T_(3))