Home
Class 11
CHEMISTRY
Following represents the Maxwell distrib...

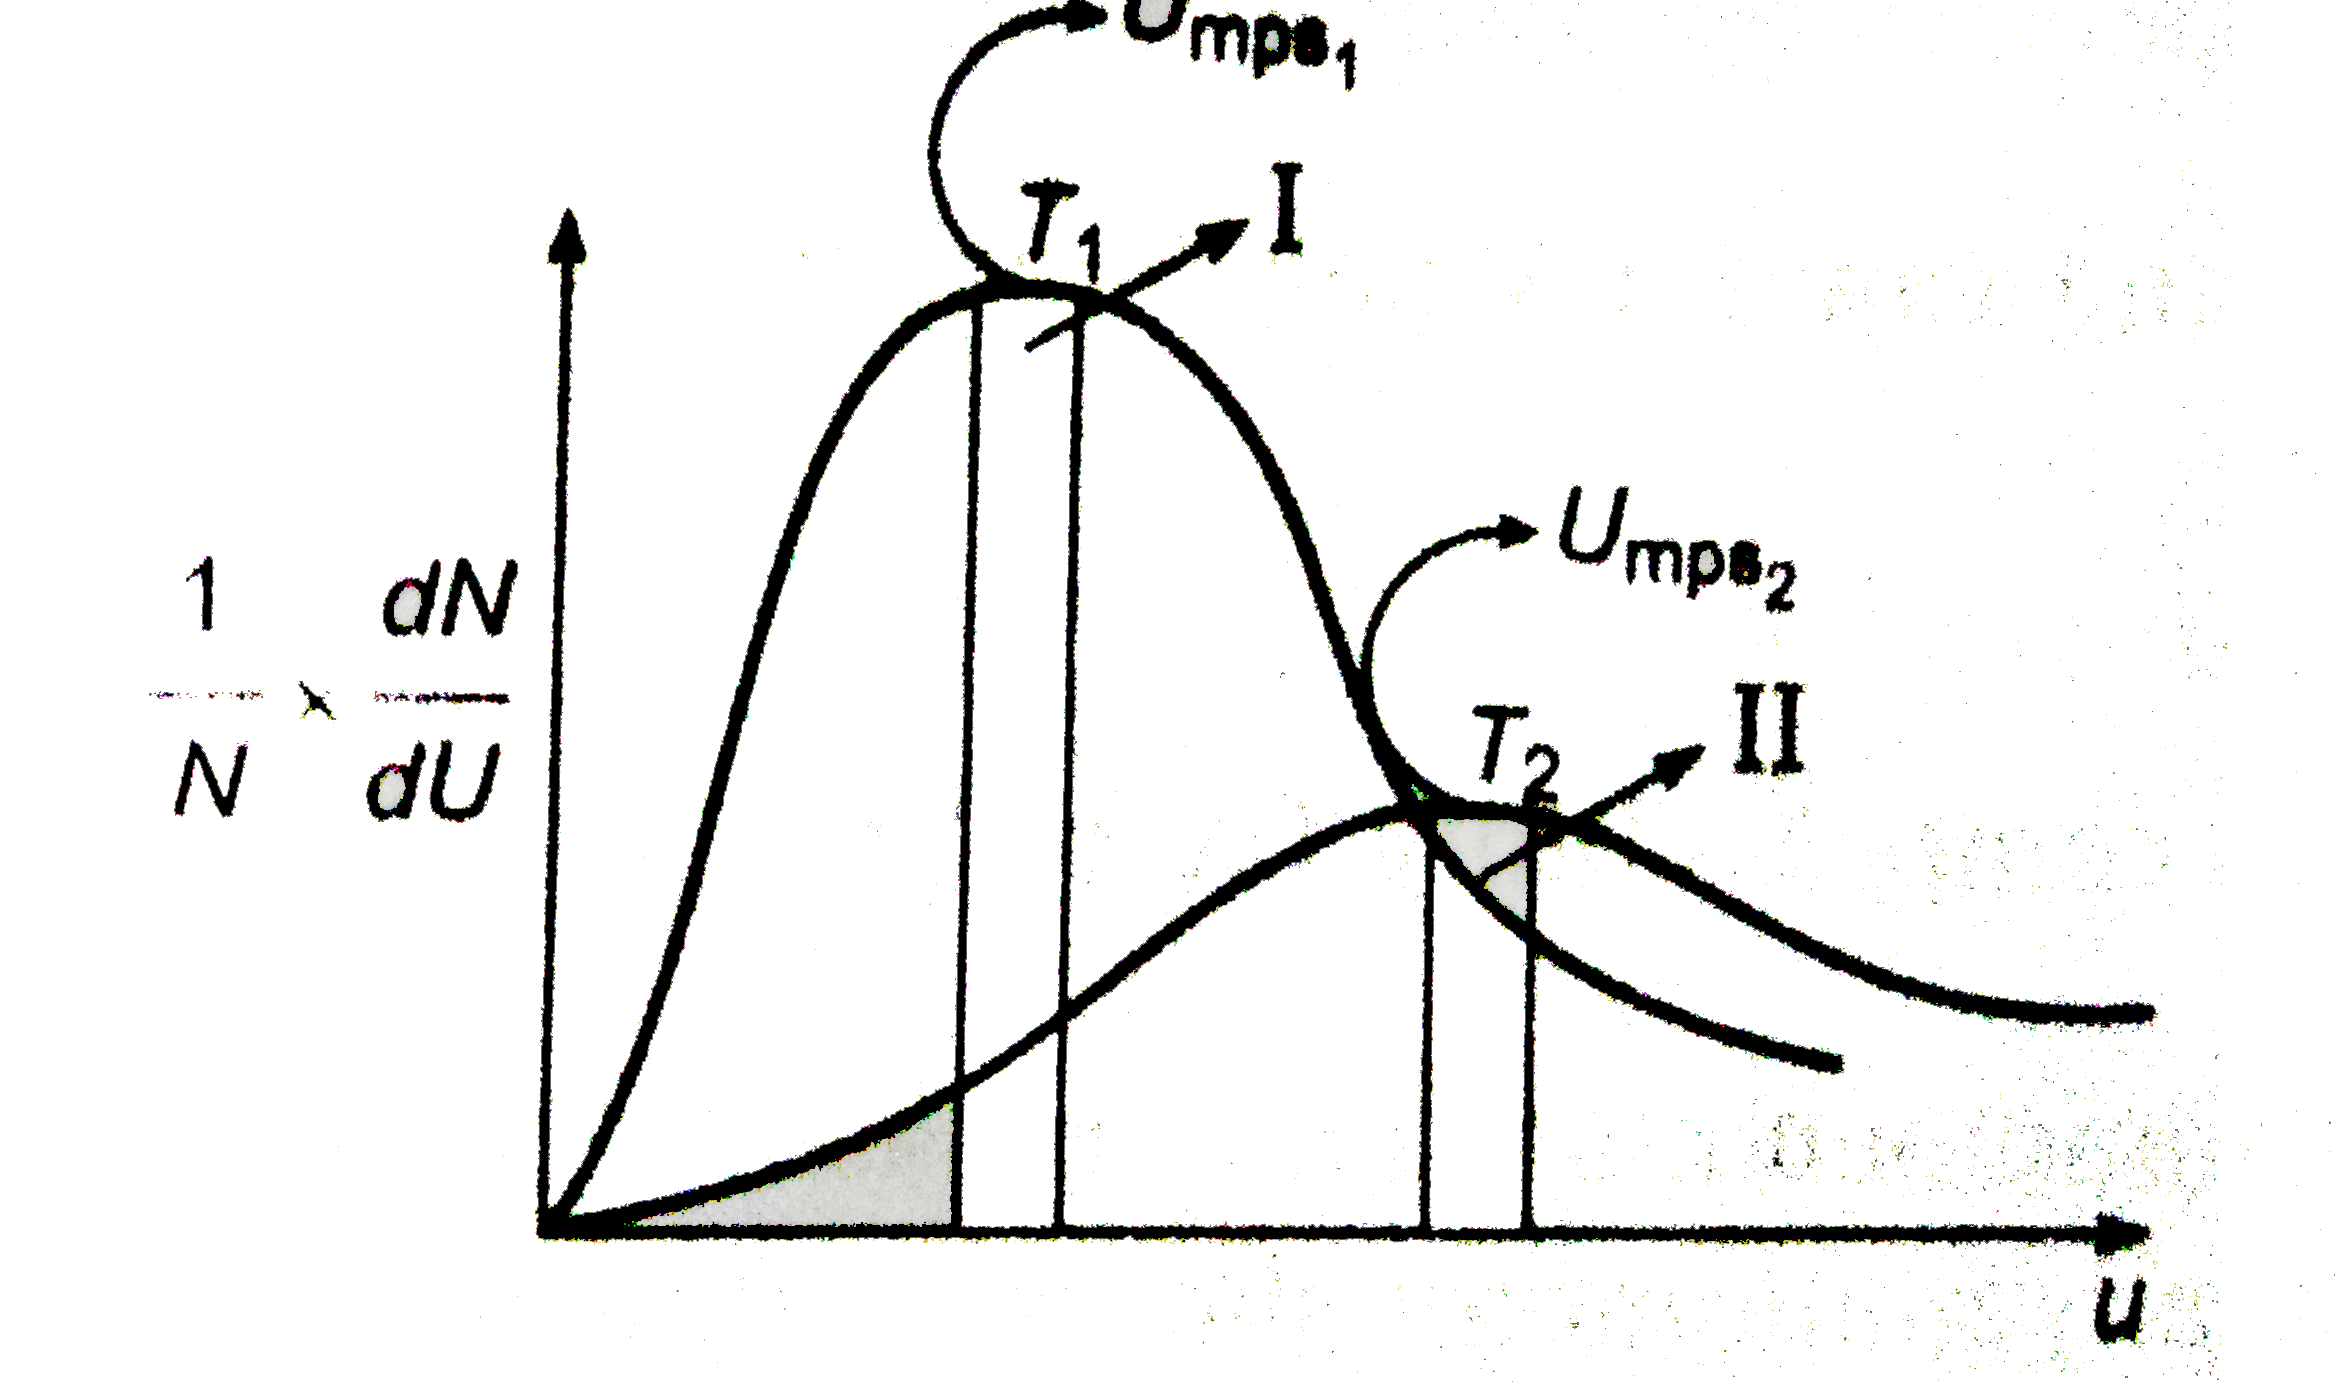
Following represents the Maxwell distribution curve for an ideal gas at two temperature `T_(1)` and `T_(2)` . Which of the following option(s) is/are true?

A

Total area under the two curves is independent to moles of gas

B

`u_(mp)` decrease as temperature decreases

C

`T_(1)gtT_(2)` and hence higher the temperature, sharper the curve

D

The fraction of molecules having speed `u_(mp)` decreases as temperature increases

Text Solution

Verified by Experts

The correct Answer is:
a,b,d

(a,b,d) (A) `:'` area under the curve gives fraction of molecules and total area is constant.
(B) `u_(mp)` decreases with decrease in temperature.
(C) `T_(2)` is higher temperature
(D) As seen from graph, `:.` A,B,D
Promotional Banner

Topper's Solved these Questions

  • GASEOUS STATE

    NARENDRA AWASTHI|Exercise Level 1 (Q.31 To Q.60)|1 Videos
  • GASEOUS STATE

    NARENDRA AWASTHI|Exercise Level 1 (Q.121 To Q.150)|1 Videos
  • ELECTROCHEMISTRY

    NARENDRA AWASTHI|Exercise Level 3 - Subjective Problems|1 Videos
  • IONIC EEQUILIBRIUM

    NARENDRA AWASTHI|Exercise Exercise|196 Videos

Similar Questions

Explore conceptually related problems

Figure shows graphs of pressure vs density for an ideal gas at two temperature T_(1) and T_(2) . Which of the following is correct ?

Figure shows graphs of pressure vs density for an ideal gas at two temperature T_(1) and T_(2) . Which of the following is correct?

show graphs of pressure vs density for an ideal gas at two temperatures T_(1)andT_(2)

Figure shows graphs of pressure vs density for an ideal gas at two temperatures T_(t) and T_(2)

Figure shows graphs of pressure versus density for an ideal gas at two temperatures T_(1) and T_(2) Which is correct ? .

The adjoining fgure shows graph of pressure and volume of a gas at two temperatures T_(1) and T_(2) Which one the following is correct