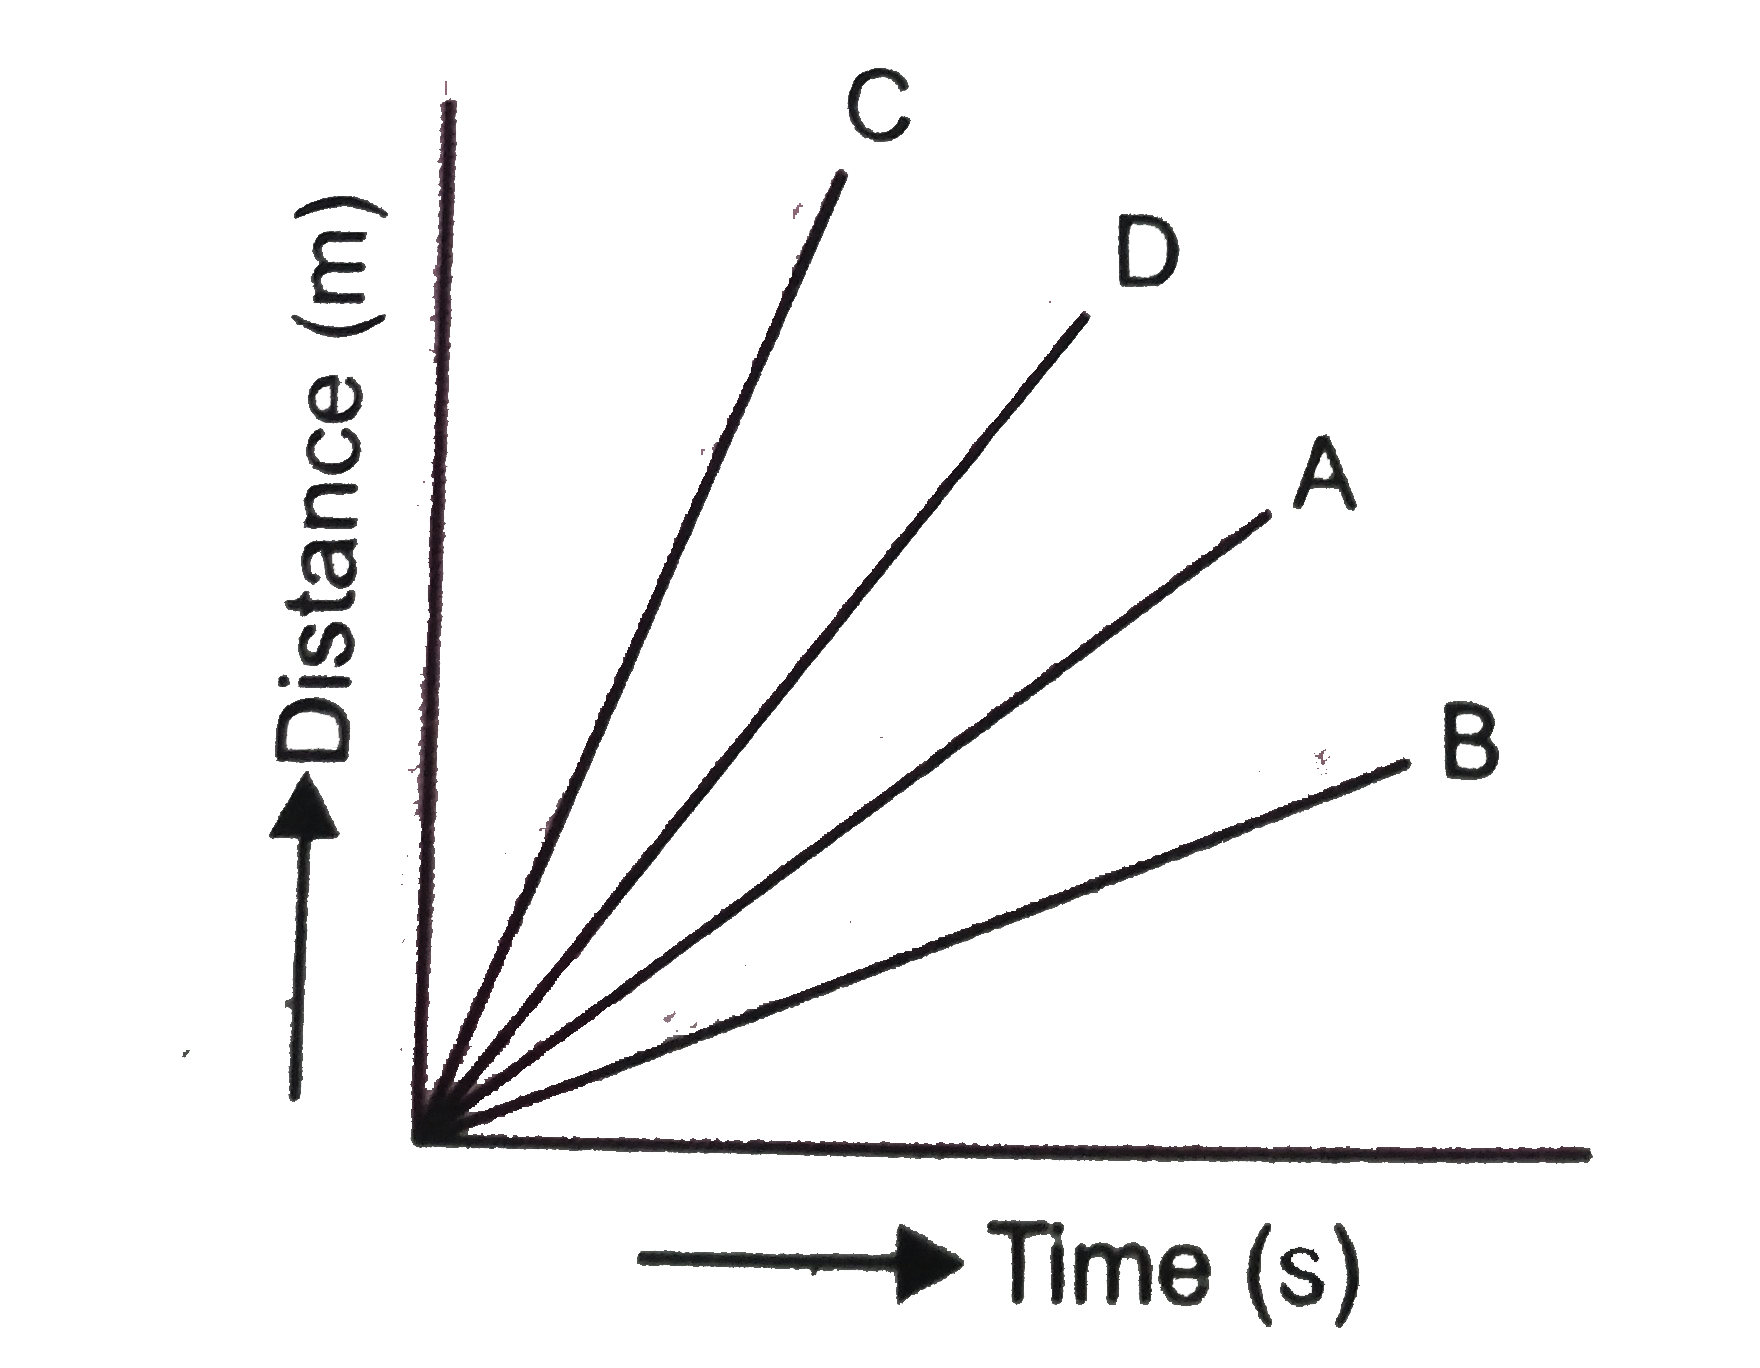
Four cars `A, B` and `C` are moving on a levelled road. Their distance versus time graphs are shown in Fig. Choose the correct statement
A
Car A is faster than car D
B
Car B is the slowest
C
Car D is faster than car C
D
Car C is the slowest
Text Solution
Verified by Experts
The correct Answer is:
C
The slope of distance-time graph represents the speed. From the graph, it is clear that the solpe of distance-time graph for car B is less than all other cars. So, the slope is minimum for car B. Hence, car B is the slowest.
Topper's Solved these Questions
MOTION
NCERT EXEMPLAR|Exercise Short Answer Type Questions|1 Videos
GRAVITATION
NCERT EXEMPLAR|Exercise Gravitation|26 Videos
SOUND
NCERT EXEMPLAR|Exercise Sound|20 Videos
Similar Questions
Explore conceptually related problems
The distance versus time graph of a car is shown in the given figure.
Three identical bulbs are connected as shown in fig-ure. Choose the correct statement.
Three identical bulbs are connected as shown in fig-ure. Choose the correct statement.
Force acting on a block versus time graph is as shown in figure Choose the correct options. (g = 10 m//s^(-2))
A graph of x versus t is shown in figure. Choose correct alternative from below.
The velocity - time graph of two bodies A and B is shown in figure. Choose correct statement.
Single force is acting on a body and velocity versus time graph is as shown. The correct statement is
Displacement versus time curve for a particle executing SHM is shown in figure. Choose the correct statements.
Pressure versus temperature graphs of an ideal gas are as shown in figure. Choose the wrong statement
Car A and car B move on a straight road and their velocity versus time graph are as shown in figure. Comparing the motion or car A in between t=0 to t =8 sec . And motion of car B in between t=0 to t=7 sec ., pick up the correct statement. .