


NCERT EXEMPLAR-LINEAR EQUATION IN TWO VARIABLES-Linear Equation In Two Variables
- The graph of the linear equation x+2y=7 passes through the point (0,7)...
Text Solution
|
- The graph given below represents the linear equation x+y=0.
Text Solution
|
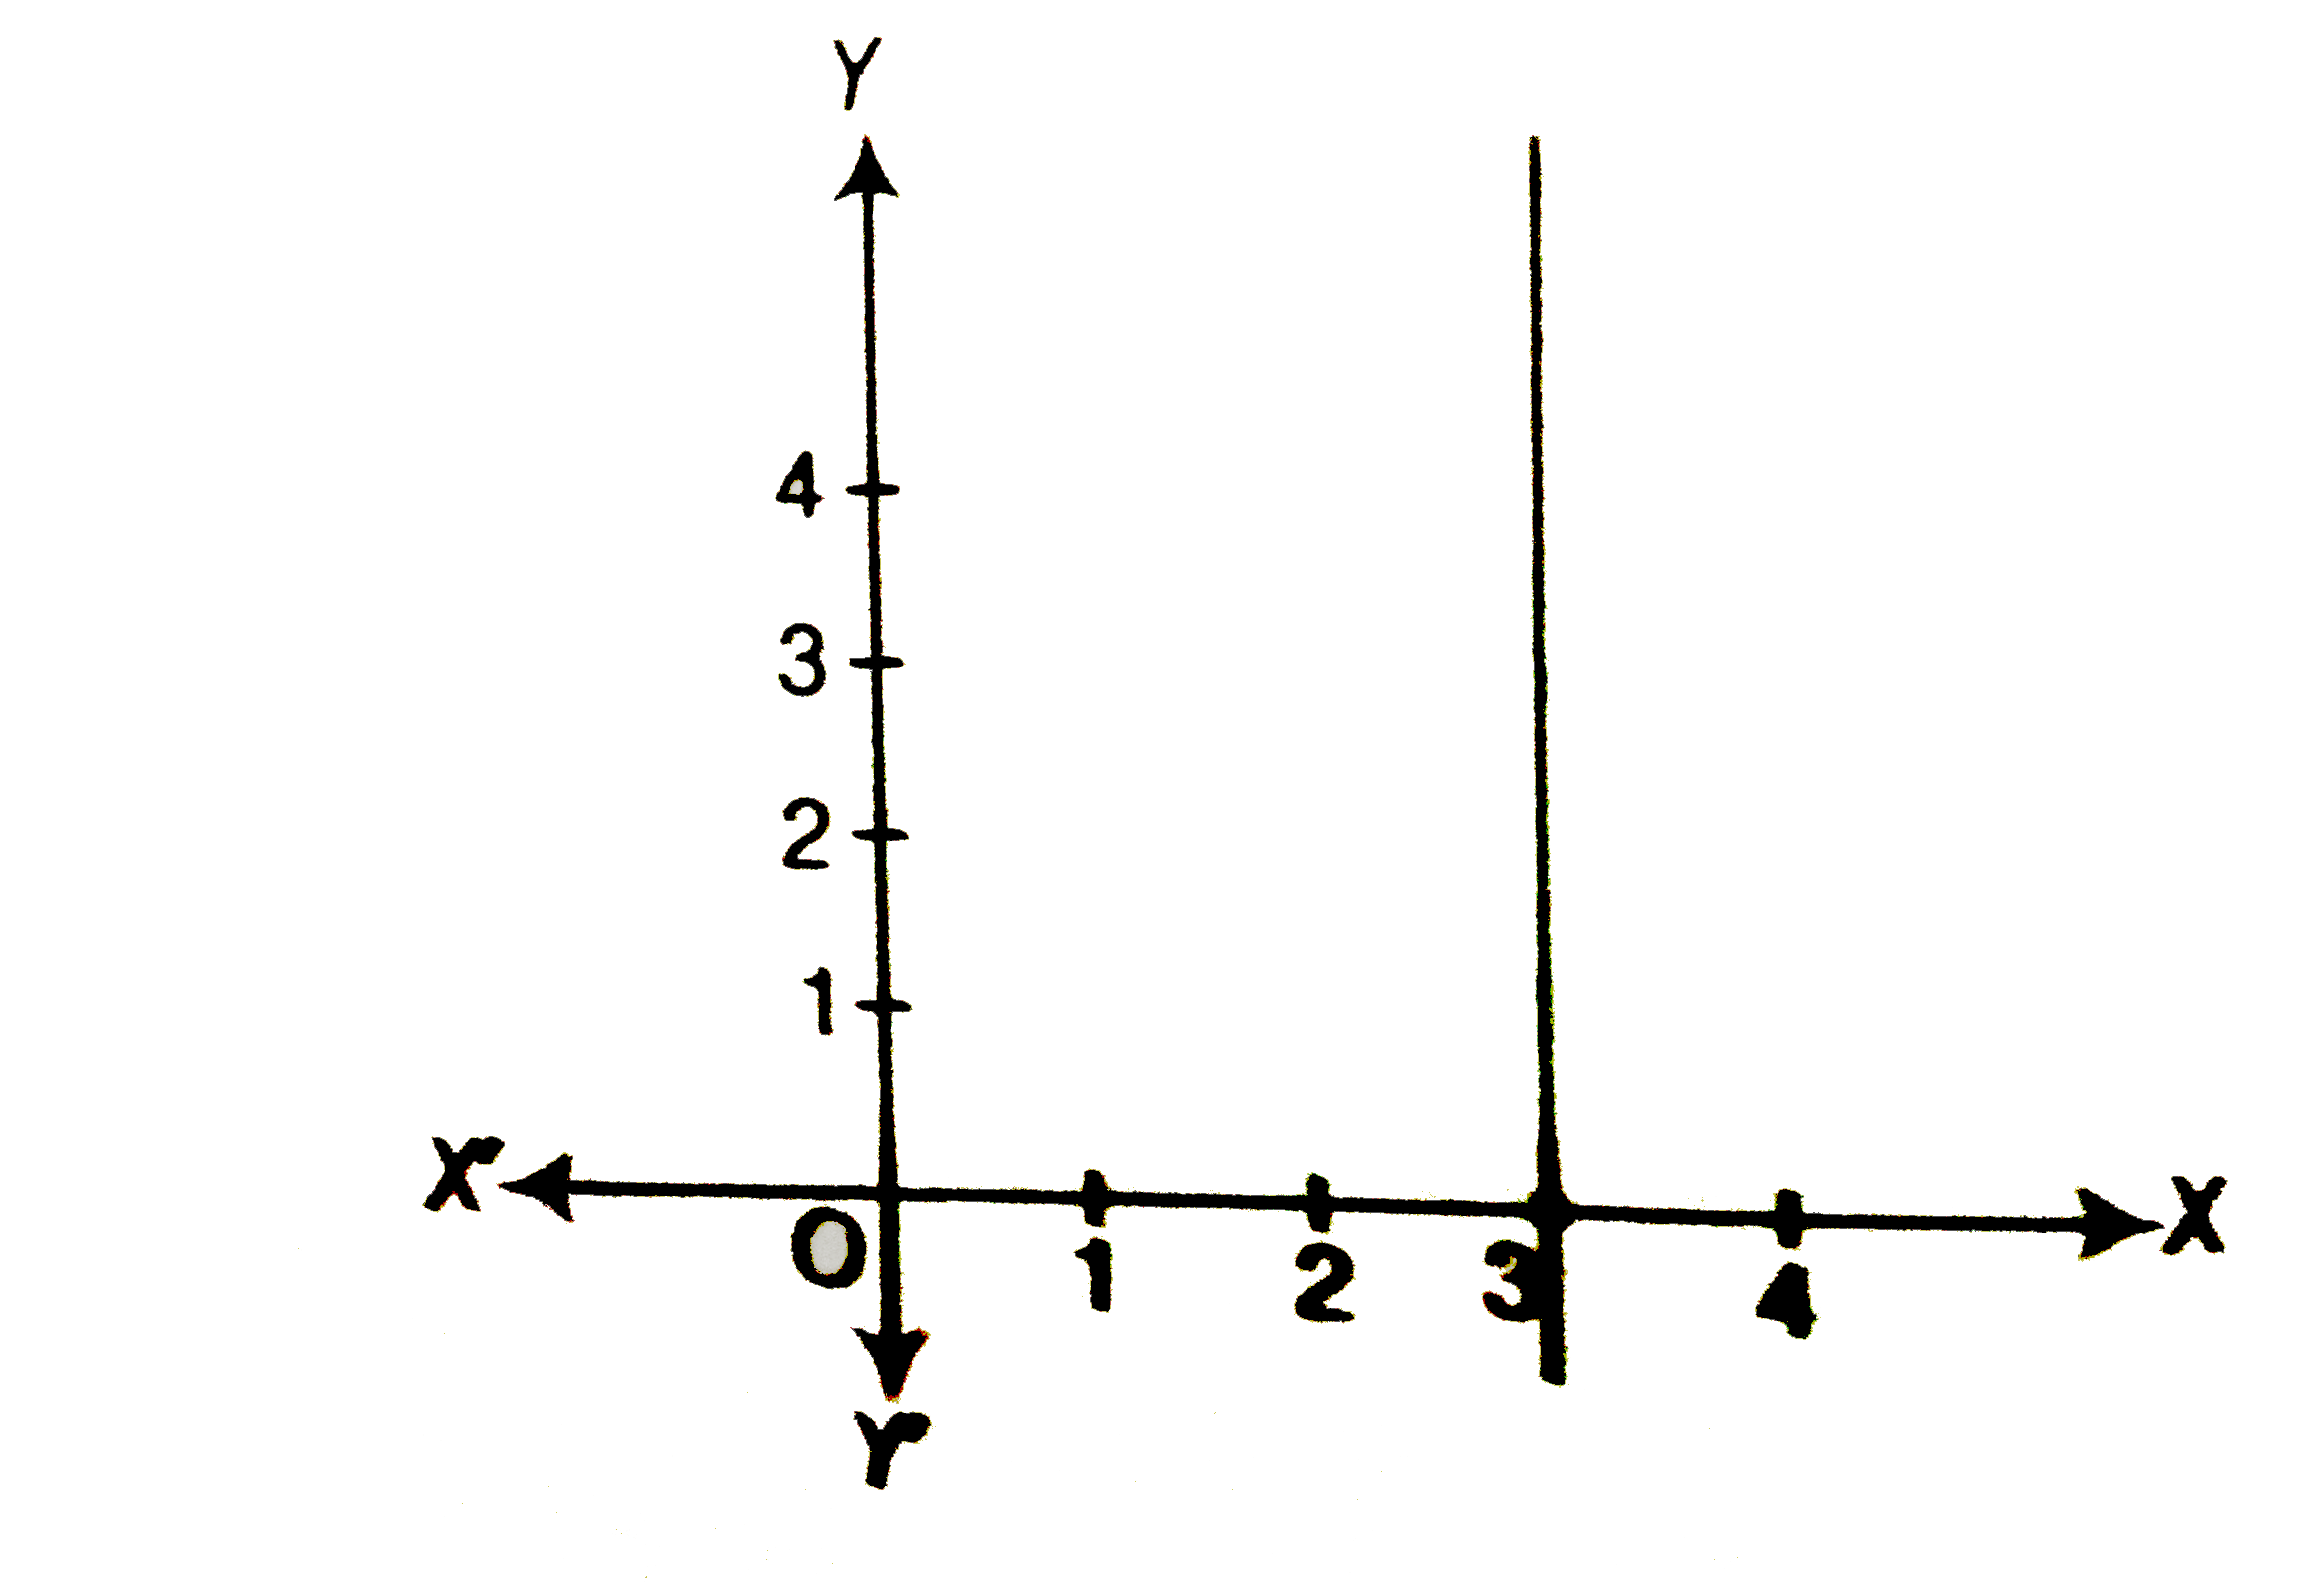
- The graph given below represents the linear equation x=3.
Text Solution
|
- The coordinates of points in the table represent some of the solu...
Text Solution
|
- Every point on the graph of a linear equation in two variables does no...
Text Solution
|
- The graph of every linear equation in two variables need not be a line...
Text Solution
|
- Draw the graphs of linear equations y=x and y=-x on the same cartesian...
Text Solution
|
- Determine the point on the graph of the linear equation 2x+5y=19 whose...
Text Solution
|
- Draw the graph of the equation represented by a straight line which is...
Text Solution
|
- Draw the graph of the linear equation whose solutions are represented ...
Text Solution
|
- Write the linear equation such that each point on its graph has an ord...
Text Solution
|
- If the point (3, 4) lies on the graph of 3y=ax+7, then find the value ...
Text Solution
|
- Solve the equation 2x+1=x-3and represent the solution(s)on (i) the nu...
Text Solution
|
- Find the solution of the linear equation x+2y =8 which represents a po...
Text Solution
|
- For what value of c, the linear equation 2x+cy=8 has equal values of x...
Text Solution
|
- Let y varies directly as x. If y=12 when x=4, then write a linear equa...
Text Solution
|
- Show that the points A (1,2), B(-1, -16) and C (0, -7) lie on the grap...
Text Solution
|
- The following observed values of x and y are thought to satisfy a line...
Text Solution
|
- Draw the graph of the linear equation 3x + 4y = 6. At what points, the...
Text Solution
|
- The linear equation that converts Fahrenheit (F) to Celsius (C ) is gi...
Text Solution
|