A
B
C
D
Text Solution
Verified by Experts
The correct Answer is:


Topper's Solved these Questions
THERMODYNAMICS
NCERT EXEMPLAR|Exercise MULTIPLE CHOICE QUESTIONS (MORE THAN ONE OPTIONS)|5 VideosTHERMODYNAMICS
NCERT EXEMPLAR|Exercise VERY SHORT ANSWER TYPE QUESTIONS|5 VideosTHERMAL PROPERTIES OF MATTER
NCERT EXEMPLAR|Exercise Very short Answer type Questions|15 VideosUNITS AND MEASUREMENTS
NCERT EXEMPLAR|Exercise Long Answer Type Questions|9 Videos
Similar Questions
Explore conceptually related problems
NCERT EXEMPLAR-THERMODYNAMICS -LONG ANSWER TYPE QUESTIONS
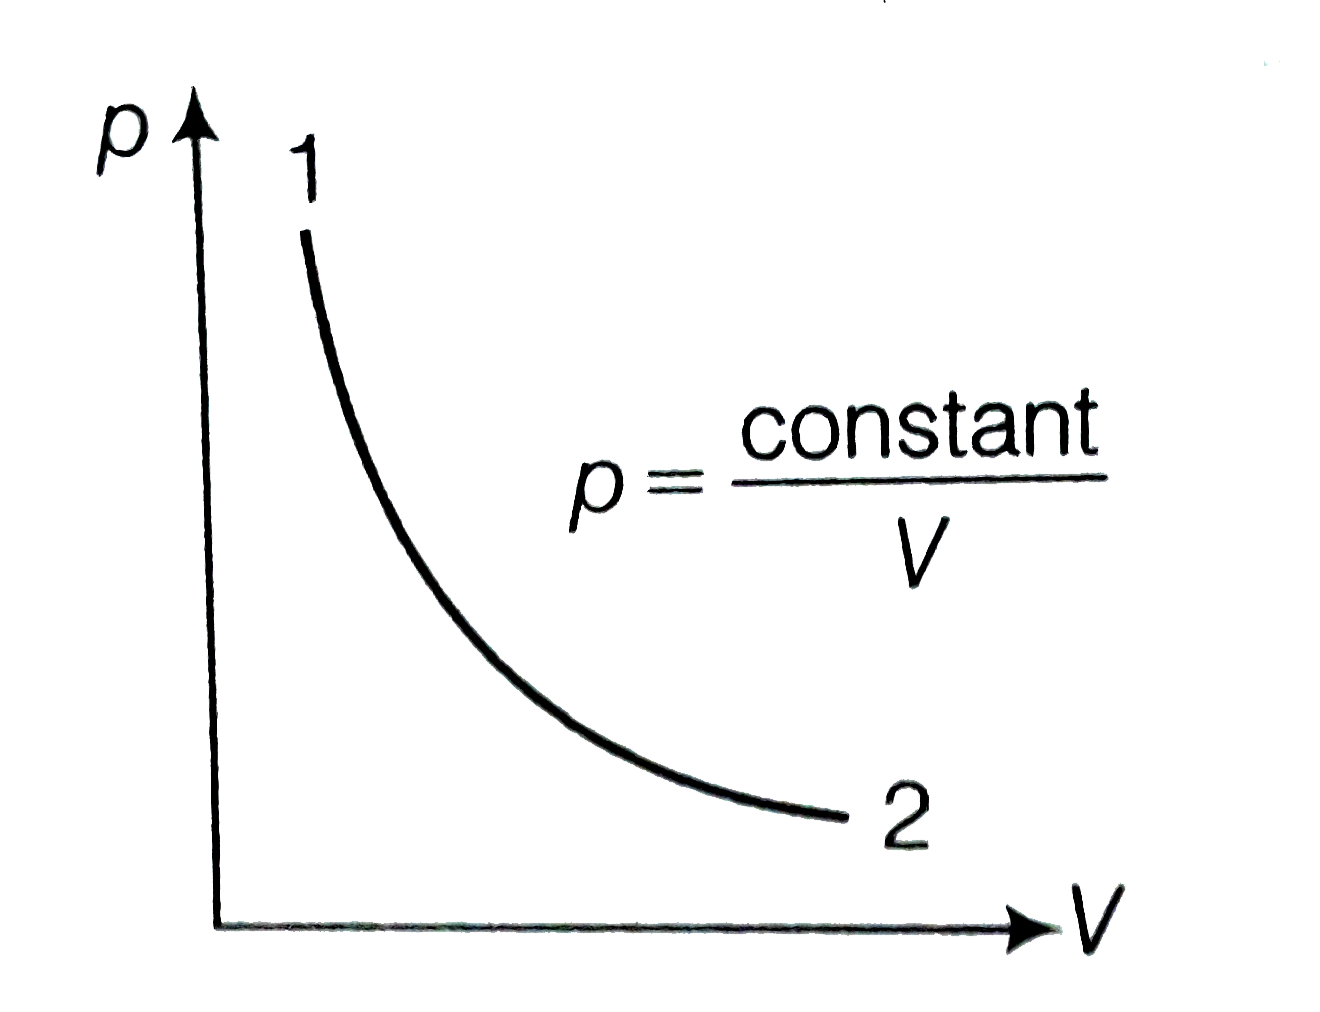
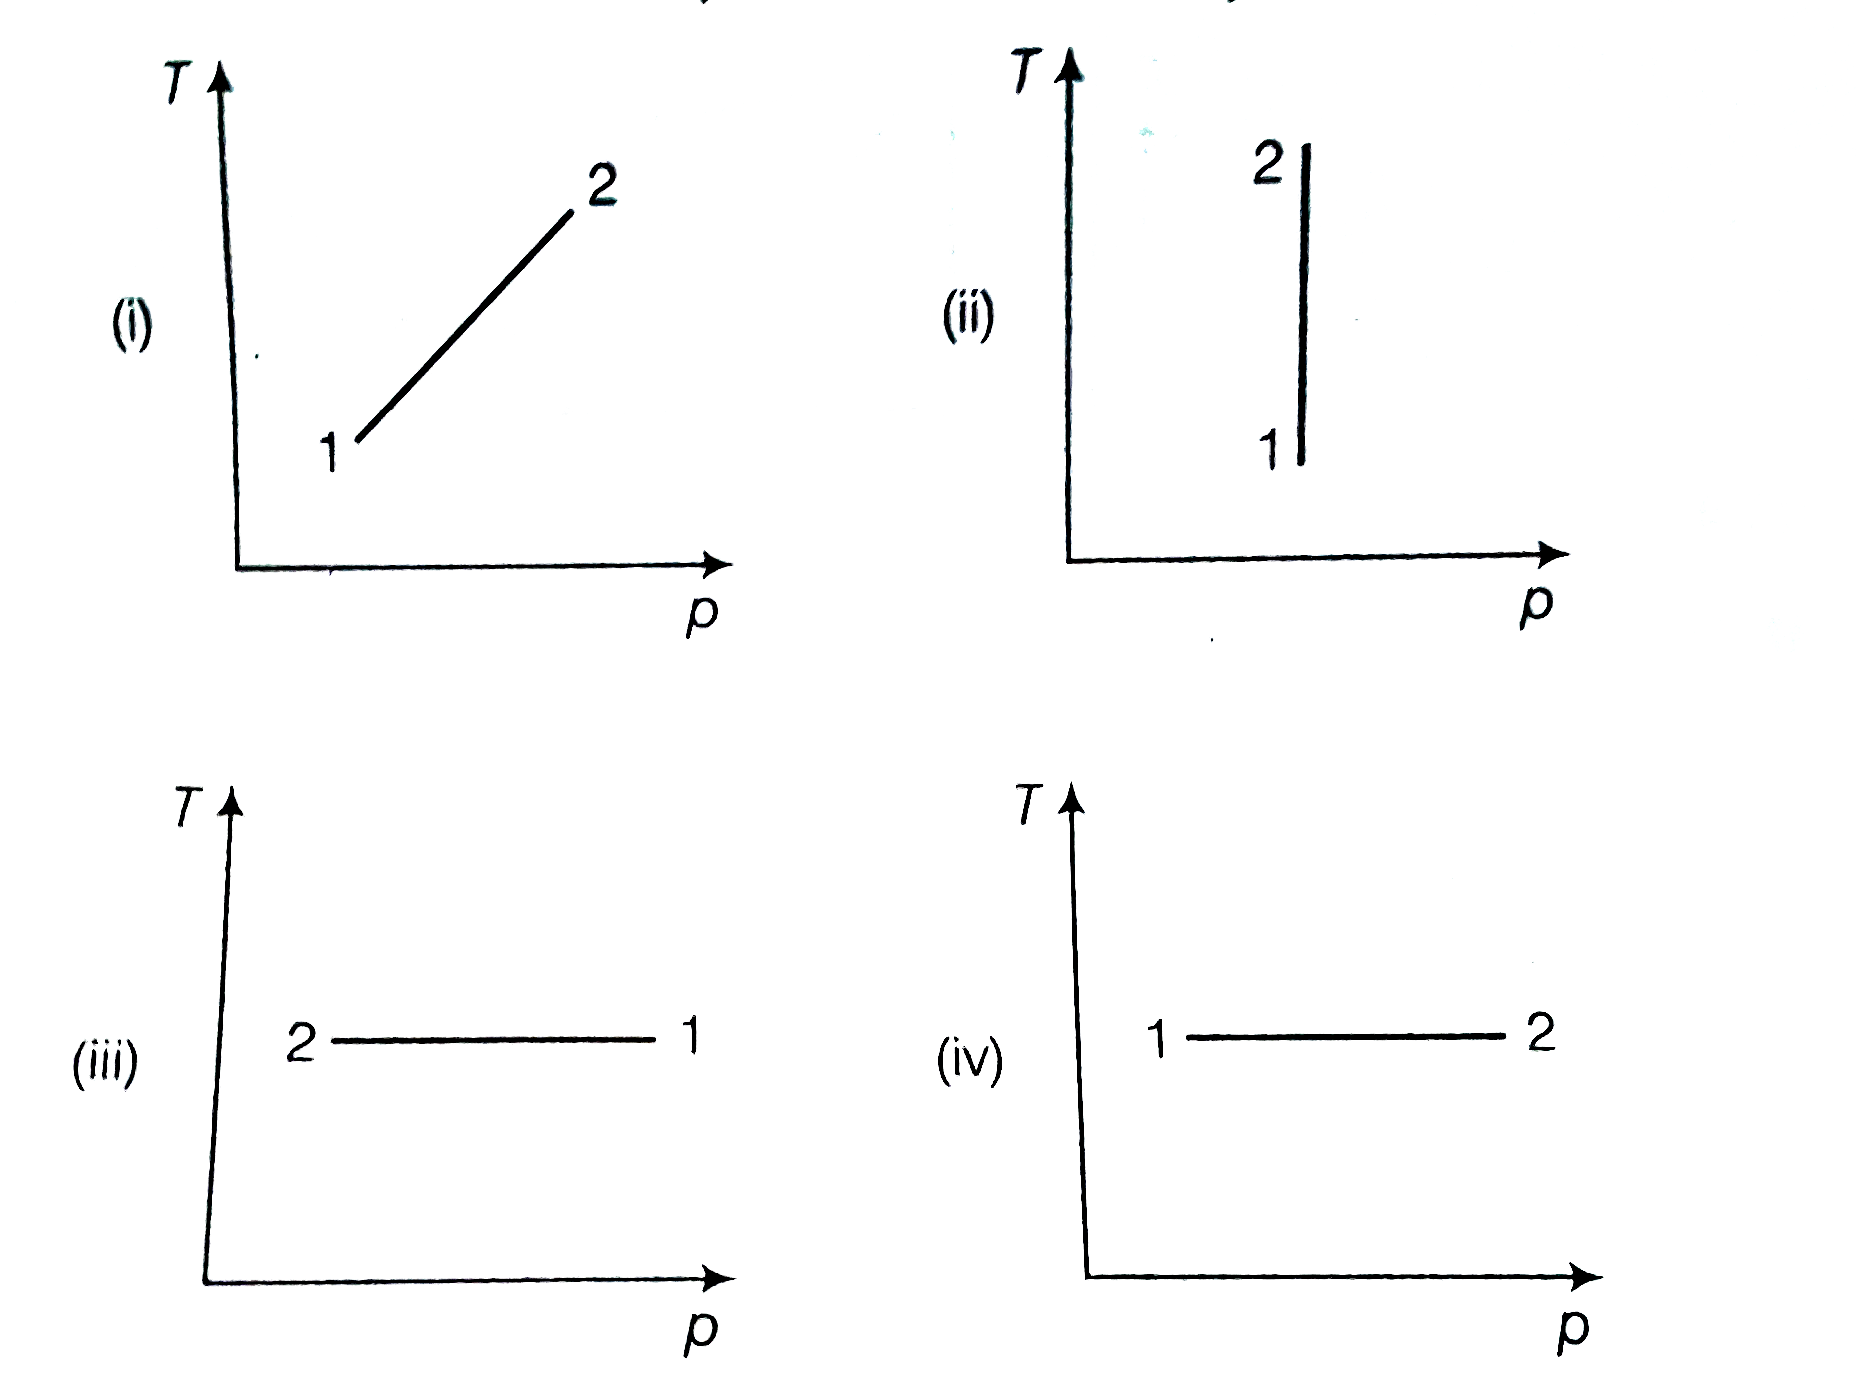
- Consider p-V diagram for an ideal gas shown in figure. Out of the...
Text Solution
|
- Consider a P-V diagram in which the path followed by one mole of perfe...
Text Solution
|
- A cycle followed by an engine (made of one mole of perfect gas in a cy...
Text Solution
|
- A cycle followed by an engine (made of one mole of an ideal gas in...
Text Solution
|
- Consider that an idela gas (n mole) is espanding in a process gives b...
Text Solution
|
- Consider one mole of perfect gas on a cylinder of units cross-sect...
Text Solution
|