A
B
C
D
Text Solution
Verified by Experts
The correct Answer is:


Topper's Solved these Questions
Similar Questions
Explore conceptually related problems
SANDEEP GARG-CONSUMER'S EQUILIBRIUM-Revision Exercise
- An Indifference Curve represents all those combinations of two goods w...
Text Solution
|
- The consumer is in equilibrium at a point where the budget line:
Text Solution
|
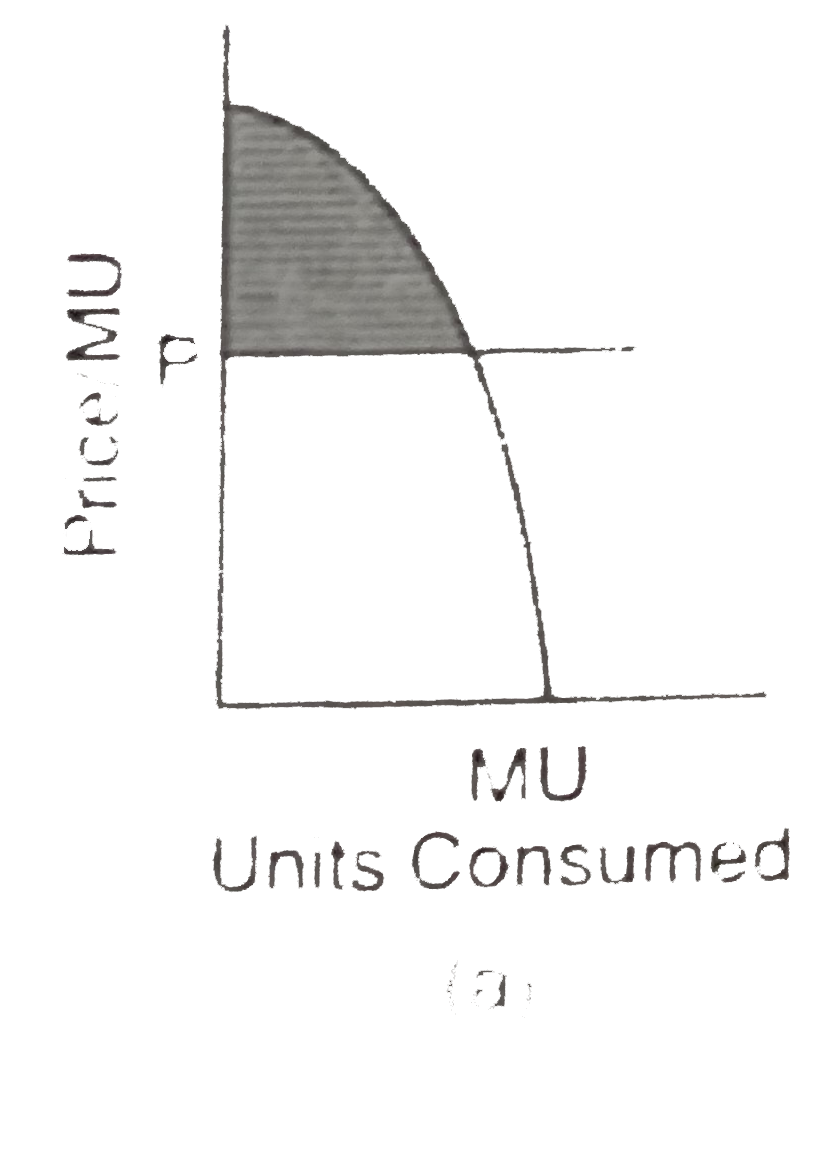
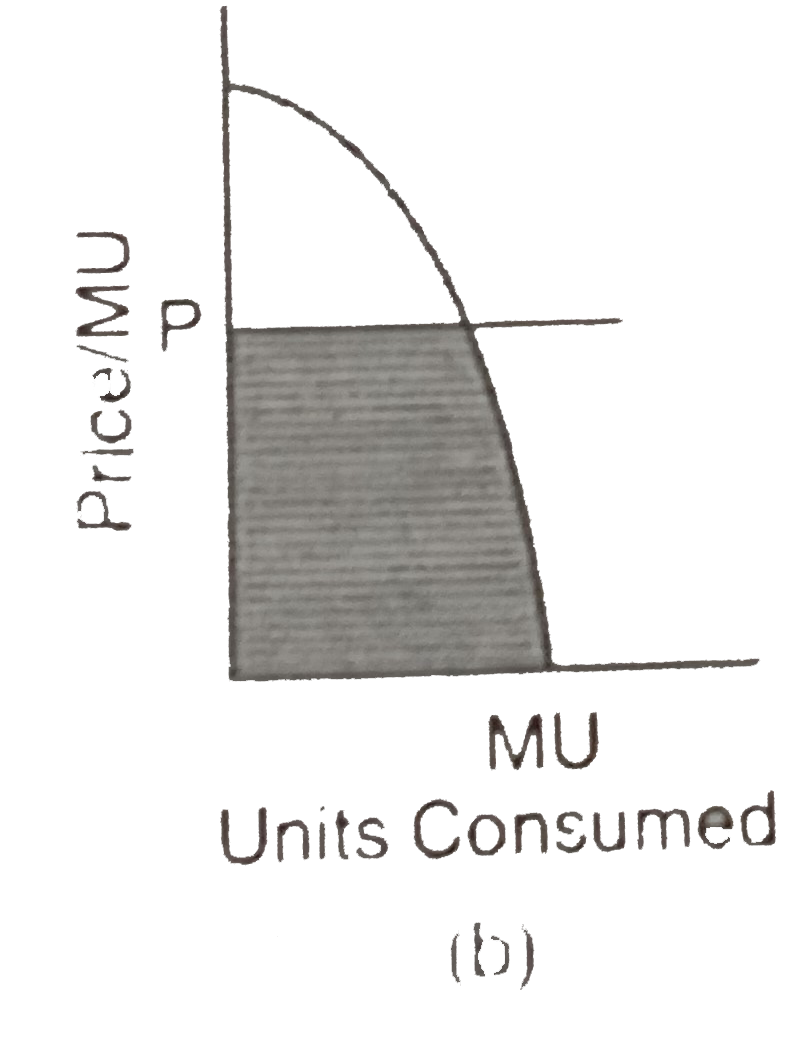
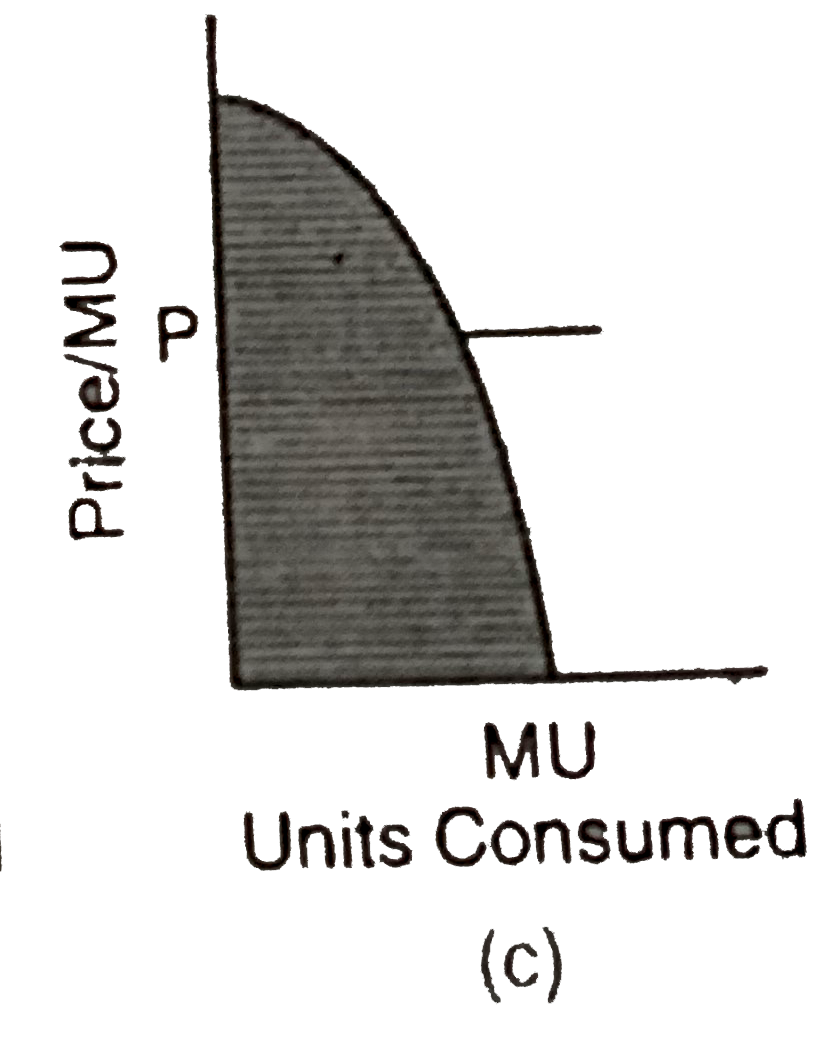
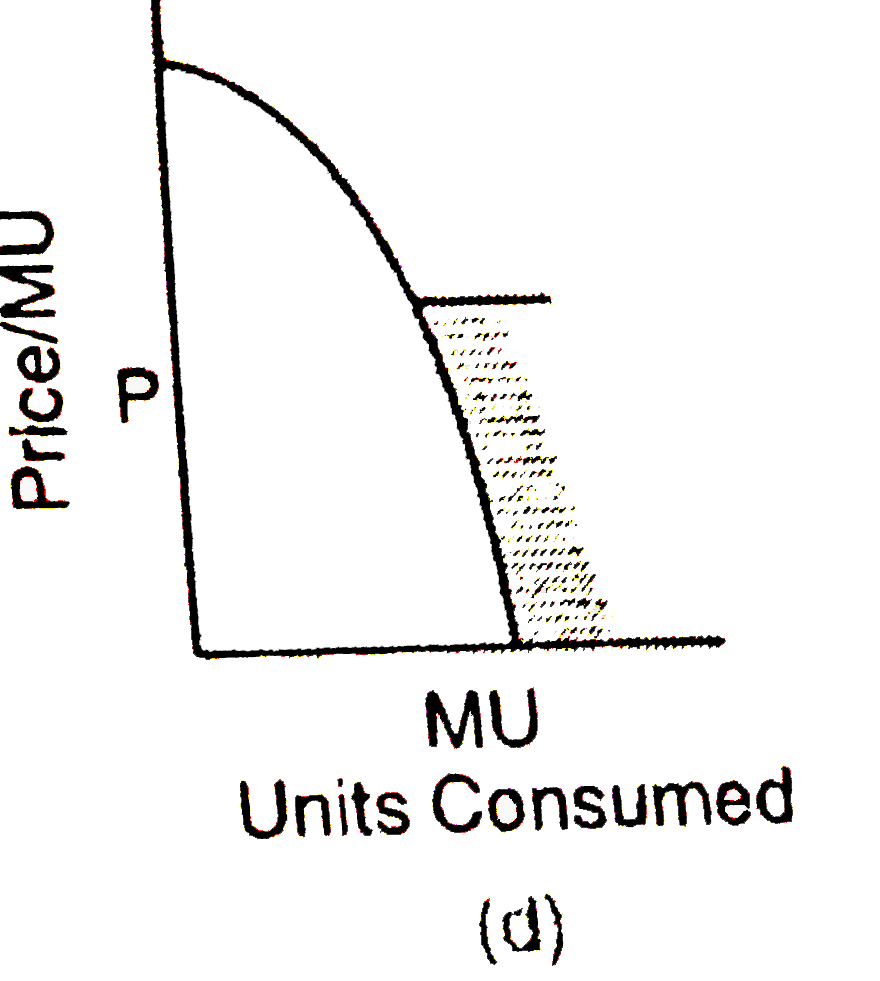
- Which of the shaded area in the diagrams below represent total utility...
Text Solution
|
- If Marginal Rate of Substituation is constant throughtout, the Indiffe...
Text Solution
|
- If Marginal Rate of Substituation is increasing throughout, the Indiff...
Text Solution
|
- A consumer consumes only two goods, If price of one of the goods falls...
Text Solution
|
- A consumer consumes only two goods X and Y both Priced at Rs 4 per uni...
Text Solution
|
- A consumer consumes only two goods X and Y whose prices are Rs 3 and R...
Text Solution
|
- In the following diagram, the situation of Consumer's Equilibrium and ...
Text Solution
|
- Which Indifference Curve represents the highest level of satisfaction ...
Text Solution
|
- An increase in income will lead to the following change in Bundget Lin...
Text Solution
|
- The rotation of budget line in the following diagram is due to:
Text Solution
|
- Marginal utility is:
Text Solution
|
- Total utility is
Text Solution
|
- Which of the following can be referred to as 'point of satiety' ?
Text Solution
|
- At the Point of Satiety,
Text Solution
|
- A consumer consumes only two goods. If price of one of the good falls,...
Text Solution
|
- Slope of an indifference Curve is measured by:
Text Solution
|
- If MU(y) = 20, MU(x) = 60, Price of Y = Rs 4, then what will be the pr...
Text Solution
|
- Market Rate of Exchange also denotes :
Text Solution
|