A
B
C
D
Text Solution
Verified by Experts
The correct Answer is:


Topper's Solved these Questions
Similar Questions
Explore conceptually related problems
SANDEEP GARG-COST-Multiple Choice Qns
- Which of the following statement is true ?
Text Solution
|
- "" cost refers to actual payment made by the entreneur to the provide...
Text Solution
|
- The distinction drawan between fixed and variable costs is based on :
Text Solution
|
- Which of the following is an example of "Implicit cost" ?
Text Solution
|
- If a resource can be put only to particular use, then opportunity c...
Text Solution
|
- If a Firm produces zero output in the short period, then :
Text Solution
|
- With which of the following, the concept of marginal cost is closely r...
Text Solution
|
- Initially, even when there is an increase in AVC, AC may still decline...
Text Solution
|
- MC Curve cuts the AVC and ATC Curves :
Text Solution
|
- The total cost at 5 units of output is ₹ 30. The fixed cost is ₹ 5. Th...
Text Solution
|
- The average fixed cost at 4 units of output is ₹ 20. Average variabl...
Text Solution
|
- The realtionship between AC, AVC and MC is rightly shown by :
Text Solution
|
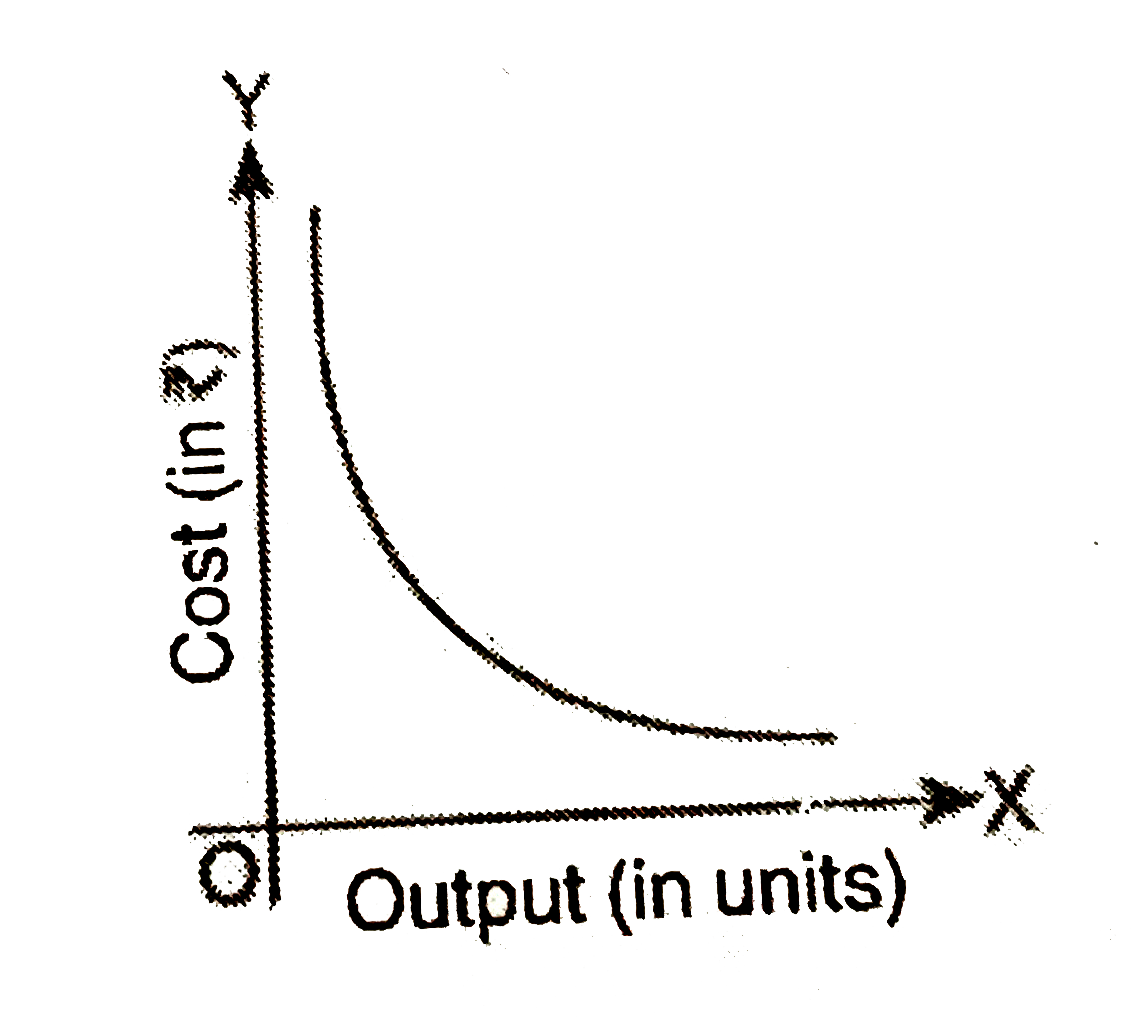
- Identify the following curve :
Text Solution
|
- Which of the following diagram correctly depicts the relationship bet...
Text Solution
|
- The area under the following curve is equal to :
Text Solution
|
- Which of the following diagram correctly depicts the ralation between ...
Text Solution
|
- When AC gt MC, then MC can:
Text Solution
|
- Out of the following costs, which cost can never be zero :
Text Solution
|
- If a firm's production department data says that the TVC for producing...
Text Solution
|
- When average cost falls, marginal cost: (Choose the correct alterna...
Text Solution
|