Text Solution
Verified by Experts


Topper's Solved these Questions
PRICE DETERMINATION AND SIMPLE APPLICATIONS
SANDEEP GARG|Exercise Very Short Answer Type Questions|22 VideosPRICE DETERMINATION AND SIMPLE APPLICATIONS
SANDEEP GARG|Exercise Multiple Choise Questions|29 VideosPRICE DETERMINATION AND SIMPLE APPLICATIONS
SANDEEP GARG|Exercise TRUE AND FALSE|14 VideosMAIN MARKET FORMS
SANDEEP GARG|Exercise Very short|17 VideosPRODUCER'S EQUILIBRIUM
SANDEEP GARG|Exercise Unsolved Practicals|12 Videos
Similar Questions
Explore conceptually related problems
SANDEEP GARG-PRICE DETERMINATION AND SIMPLE APPLICATIONS-GUIDELINES TO NCERT QUESTIONS
- Explain market equilibrium.
Text Solution
|
- When do we say there is excess demand for a commodity in the market?
Text Solution
|
- When do we say there is excess supply for a commodity in the market?
Text Solution
|
- What will happen if the price prevailing in the market is: (i) above...
Text Solution
|
- Explain how price is determined In a perfectly competitive market with...
Text Solution
|
- Suppose the price at which equilibrium Is attained Is above the minimu...
Text Solution
|
- How are equilibrium price and quantity affected when income of the con...
Text Solution
|
- Using supply and demand curves, show how an increase in the price of s...
Text Solution
|
- How wm a change in price of coffee affect the equilibrium price of tea...
Text Solution
|
- How do the equilibrium price and quantity of a commodity change when p...
Text Solution
|
- If the price of a substitute (Y) of good X increases, what impact does...
Text Solution
|
- Suppose the demand and supply curve of commodity X in a perfectly comp...
Text Solution
|
- The market demand curve for commodity X is q^(D)=700-p. Now, let us al...
Text Solution
|
- Suppose the demand and supply curves of salt are given by: 0ltplt15 ...
Text Solution
|
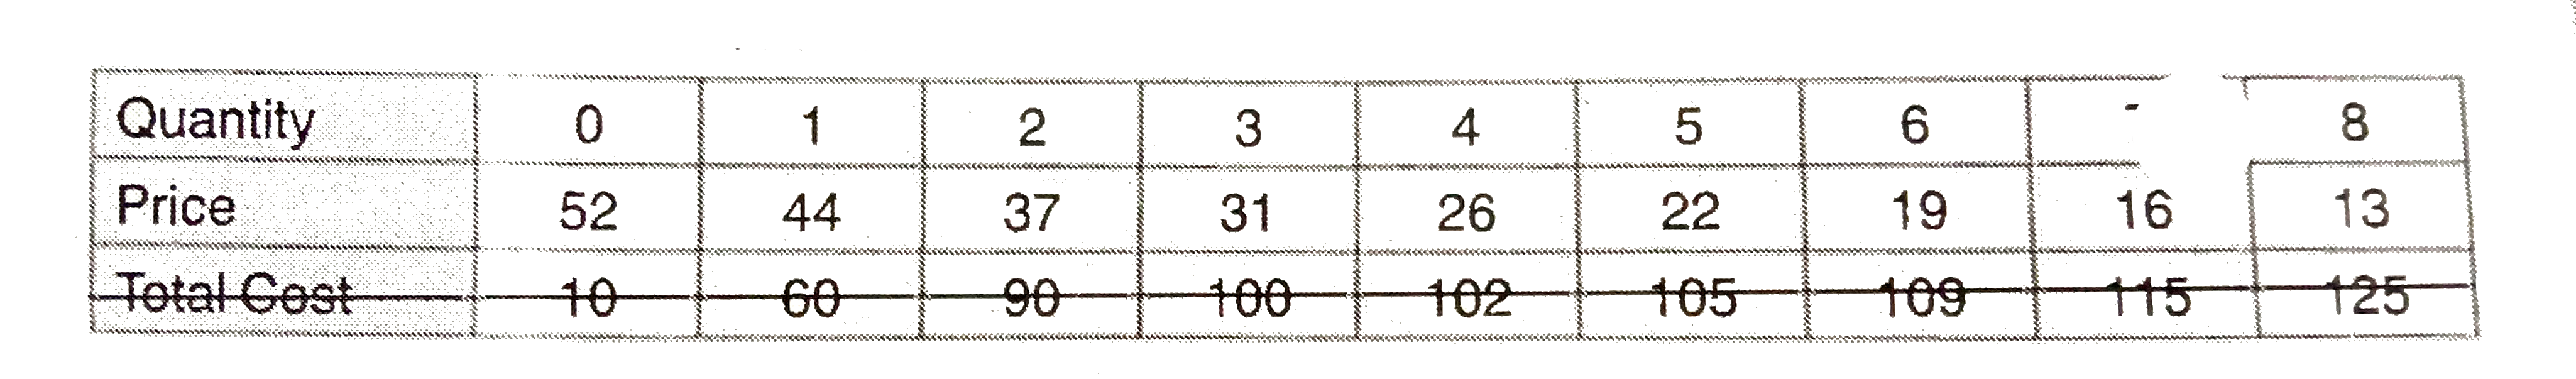
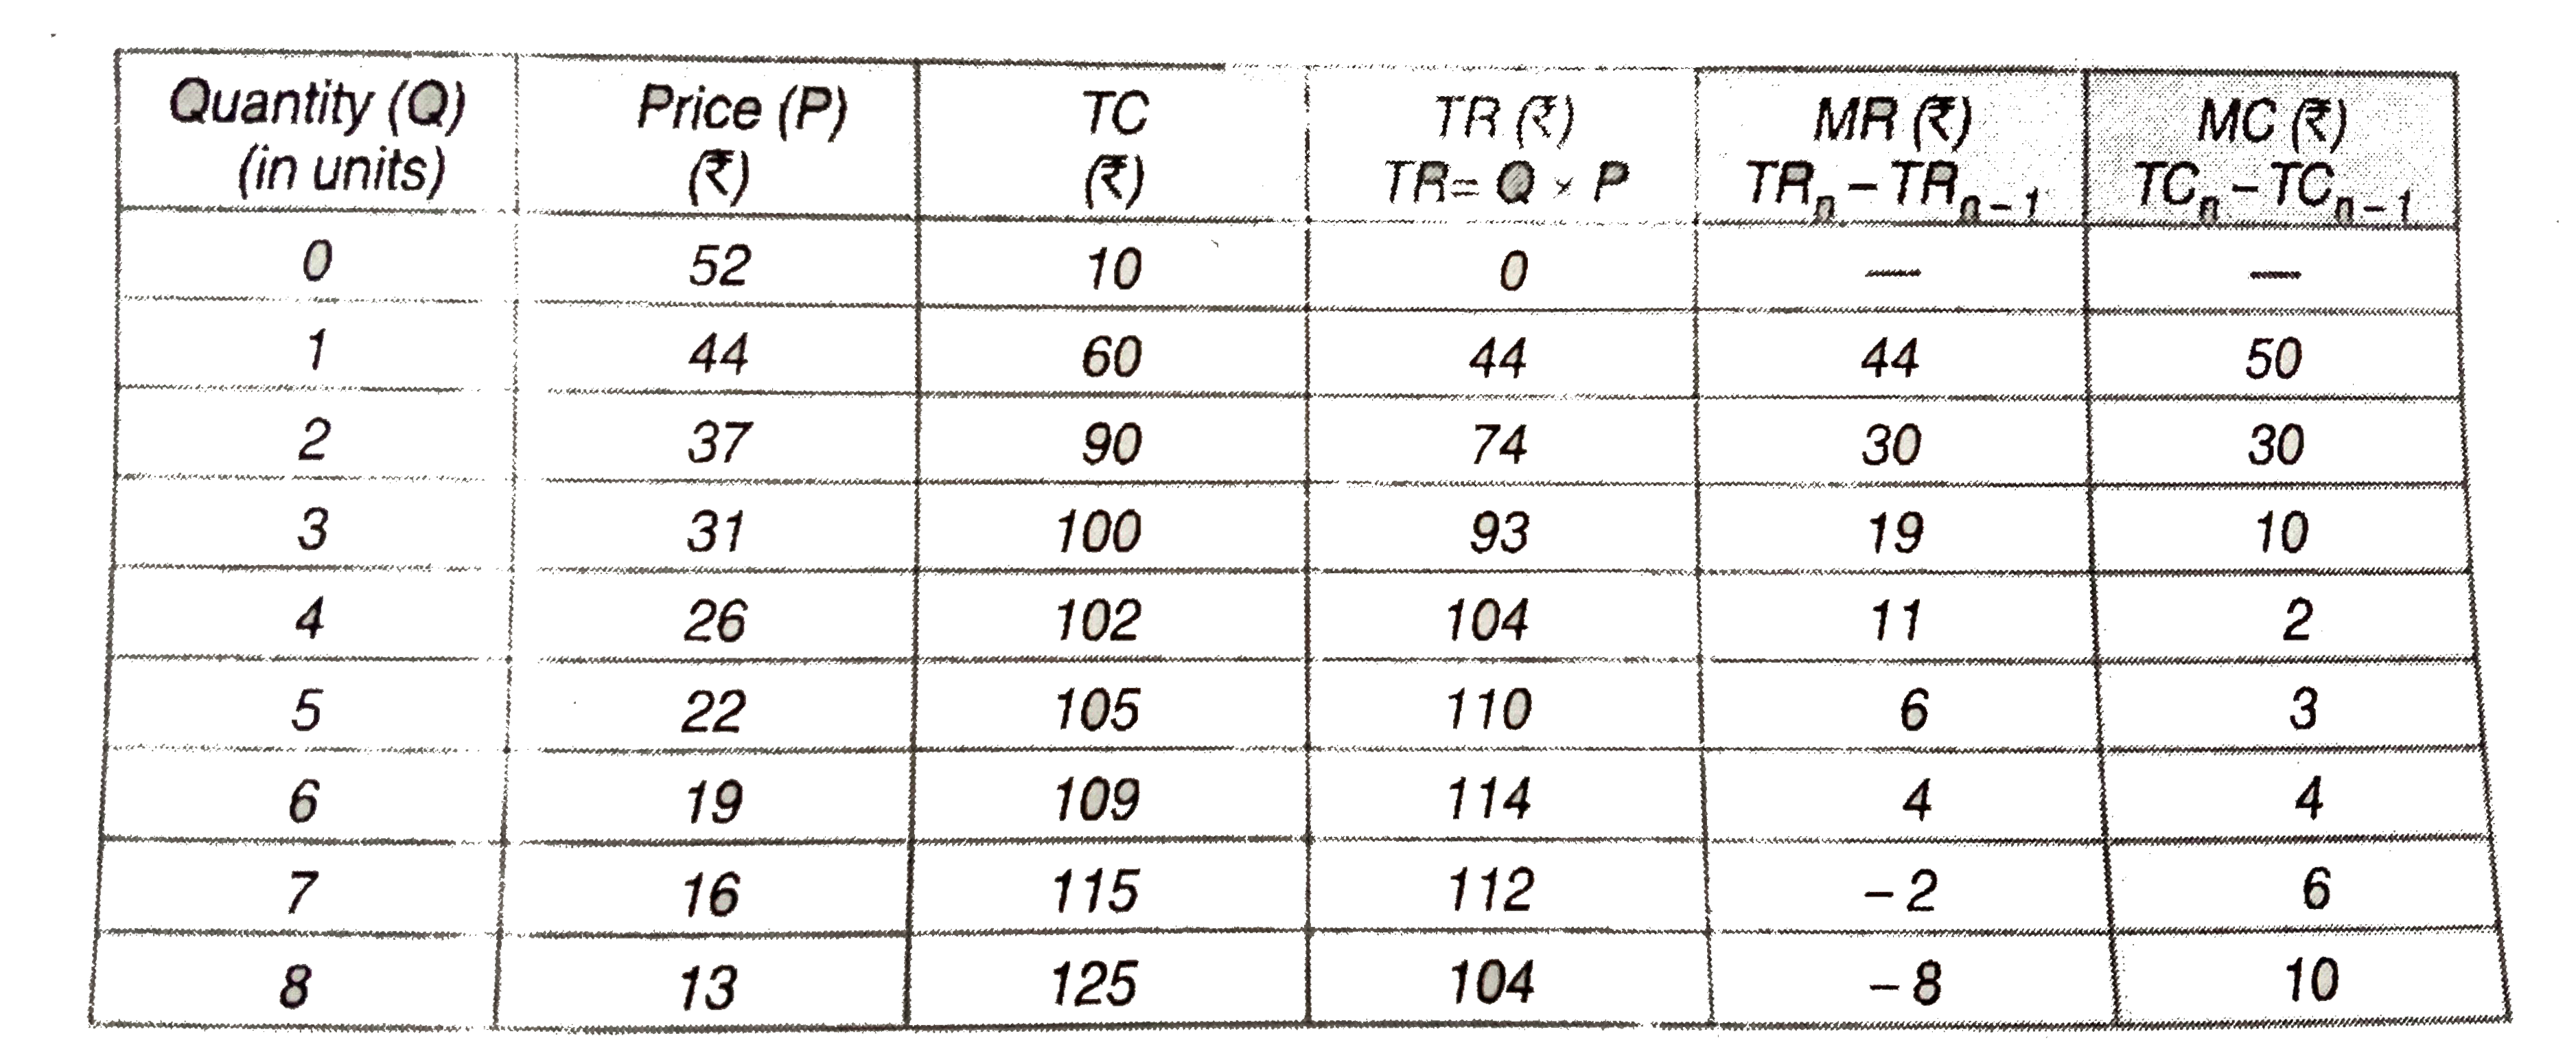
- The market demand curve for commodity and the total cost for a monopol...
Text Solution
|