Text Solution
Verified by Experts


Topper's Solved these Questions
DEMAND AND ITS DETERMINANTS
SANDEEP GARG|Exercise Model test paper 2|12 VideosDEMAND AND ITS DETERMINANTS
SANDEEP GARG|Exercise Model test paper 3|12 VideosDEMAND AND ITS DETERMINANTS
SANDEEP GARG|Exercise Model test paper 3|12 VideosDEMAND
SANDEEP GARG|Exercise Unsolved particles|4 VideosELASTICITY OF DEMAND
SANDEEP GARG|Exercise Unsolved practicals|79 Videos
Similar Questions
Explore conceptually related problems
SANDEEP GARG-DEMAND AND ITS DETERMINANTS-Model test paper 1
- Define opportunity cost.
Text Solution
|
- At what level of production is total cost equal to total fixed cost
Text Solution
|
- Which of the following does not cause shift of suppply curve of a good...
Text Solution
|
- Which of the following measures of price elasticity shows elastic supp...
Text Solution
|
- In what circumstances may the production possibility frontier shift aw...
Text Solution
|
- A consumer buy 200 units of a good at a price of Rs 20 per unit. Price...
Text Solution
|
- Write a buyget line equation of a consumer if the two goods purchased ...
Text Solution
|
- Explain the conditions of producer's equilibrium under perfect complet...
Text Solution
|
- Explain the implications of ''freedom of entry and exit of firms'' und...
Text Solution
|
- A consumer consumes only two goods X and Y. Explain the conditions of ...
Text Solution
|
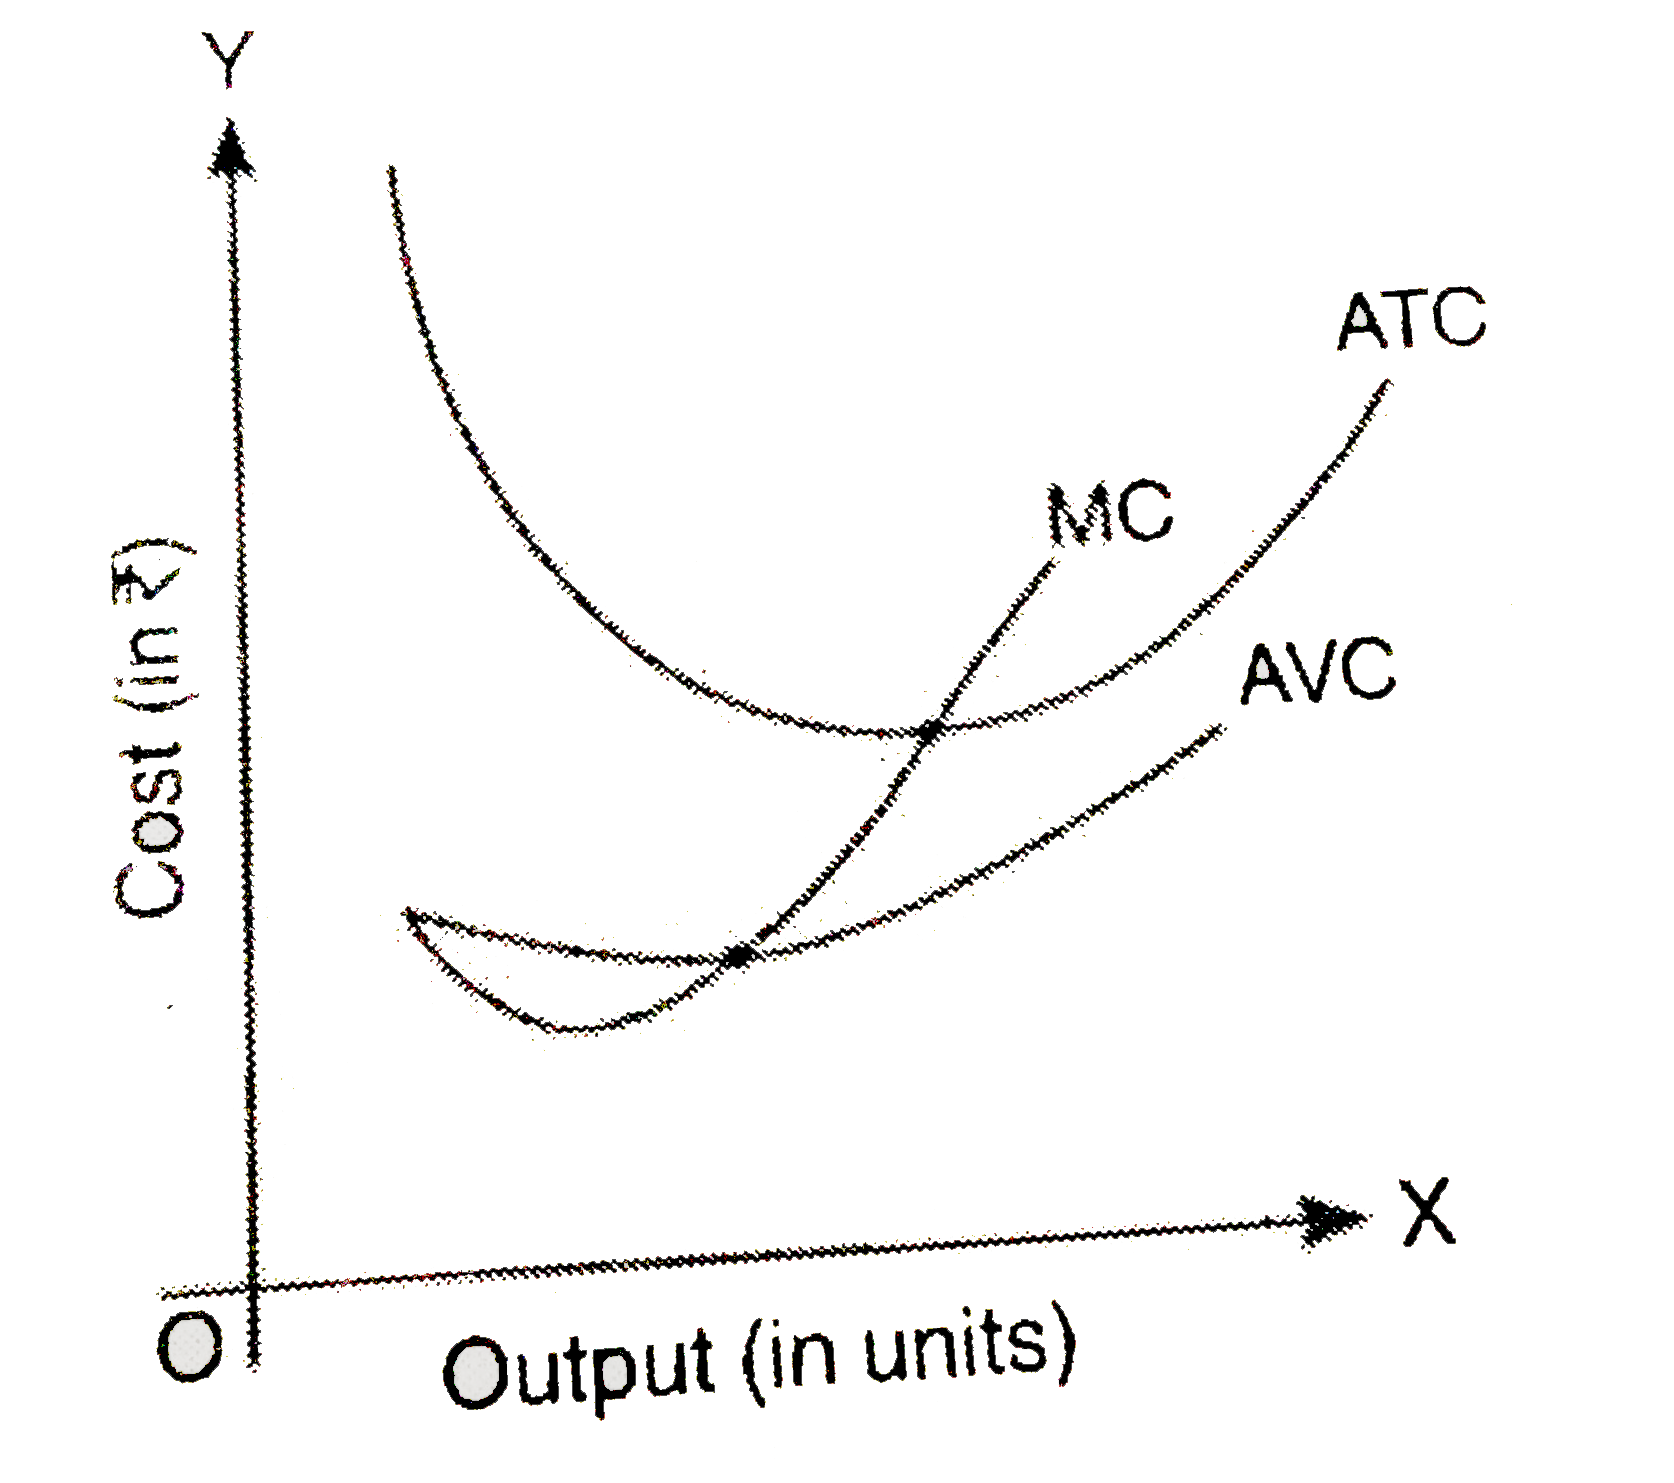
- Draw Average Variable Cost (AVC), Average Total Cost (ATC) and Margina...
Text Solution
|
- Define price floor. Explain the impications of price floor OR Mark...
Text Solution
|