A
B
C
D
Text Solution
Verified by Experts
The correct Answer is:


Similar Questions
Explore conceptually related problems
Recommended Questions
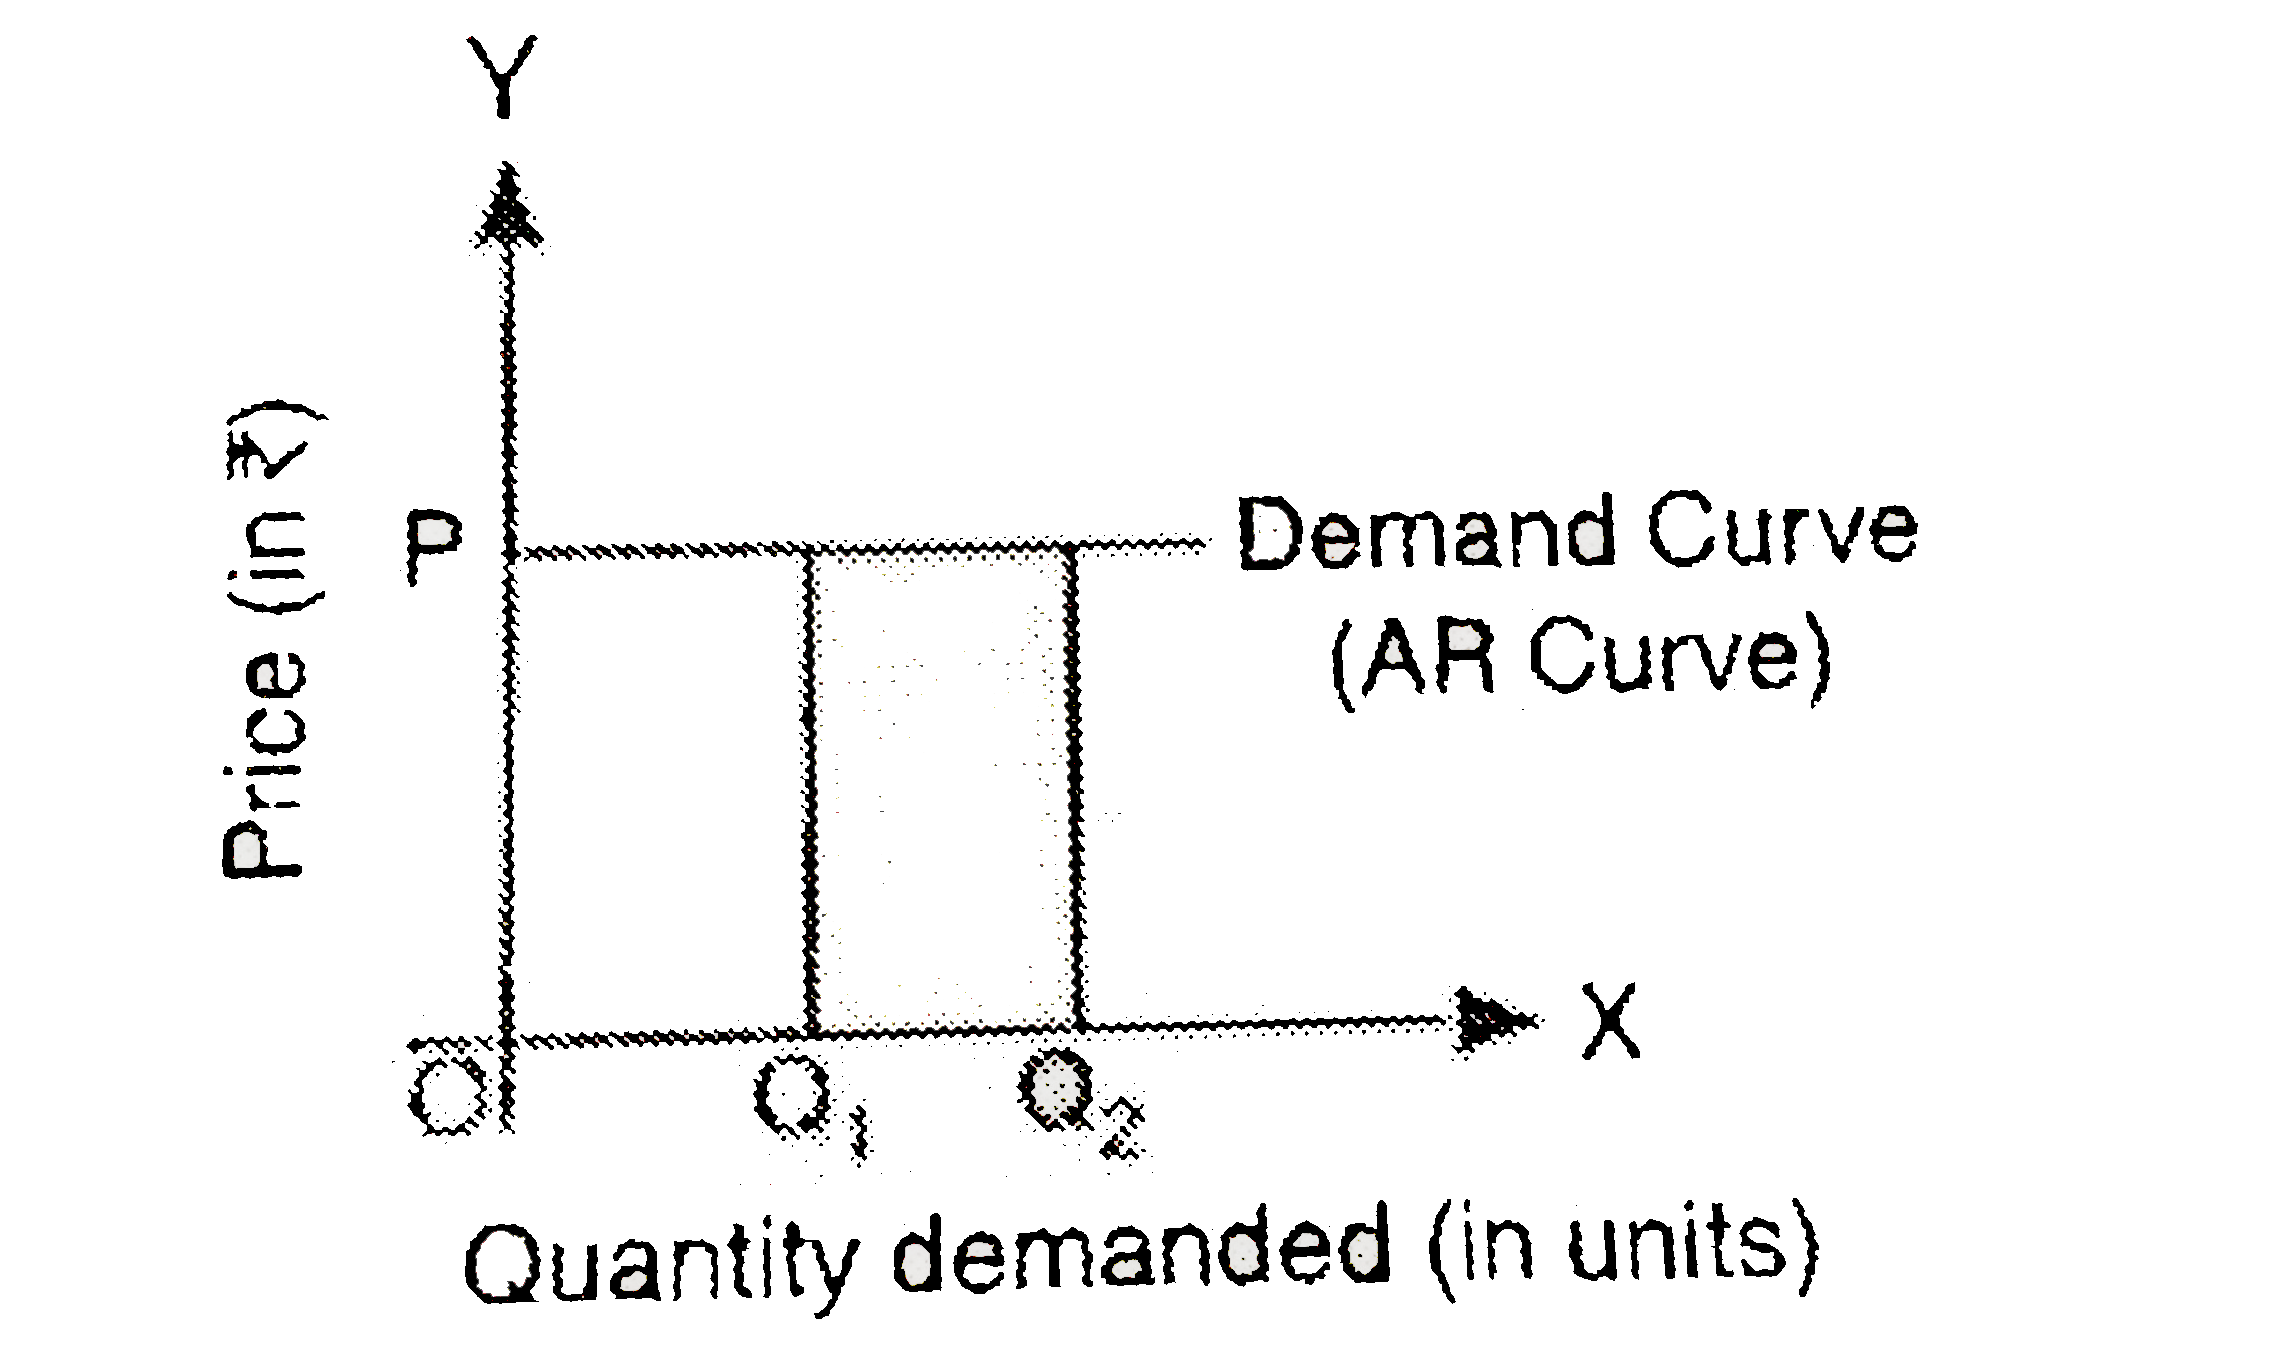
- The following diagram represents the demand curve of:
Text Solution
|
- प्रयोगशाला में क्लोरोफॉर्म बनाने की विधि का नामांकित चित्र सहित वर्णन ...
Text Solution
|
- 1.5 वोल्ट का एक आदर्श सेल 100 Omega तथा 200 Omega के प्रतिरोधों क...
Text Solution
|
- संलग्न चित्र में, यदि धारामापी G में कोई विक्षेप नहीं हैं तो एक दशा मे...
Text Solution
|
- m द्रव्यमान का कण जिस पर आवेश q है, एकसमान चुम्बकीय क्षेत्र B के लम्ब...
Text Solution
|
- प्रदत्त चित्र में दो लम्बे समान्तर धारावाही चालकों में 1 ऐम्पियर तथा ...
Text Solution
|
- प्रत्यावर्ती धरा जनित्र का सिद्धांत तथा कार्यप्रणाली चित्र द्वारा समझा...
Text Solution
|
- किसी प्रत्यावर्ती परिपथ में L ,C और R श्रेणीक्रम में जुड़े हैं ...
Text Solution
|
- वाटहीन धारा का एक परिपथ आरेख खीचिए।
Text Solution
|