A
B
C
D
Text Solution
Verified by Experts
The correct Answer is:


Topper's Solved these Questions
Similar Questions
Explore conceptually related problems
CAREER POINT-MOCK TEST 3-CHEMISTRY
- What will be the temperature at which a solution containing 6 g of glu...
Text Solution
|
- In a Cu-voltameter, mass deposited in 30 s is m gm. If the time-curren...
Text Solution
|
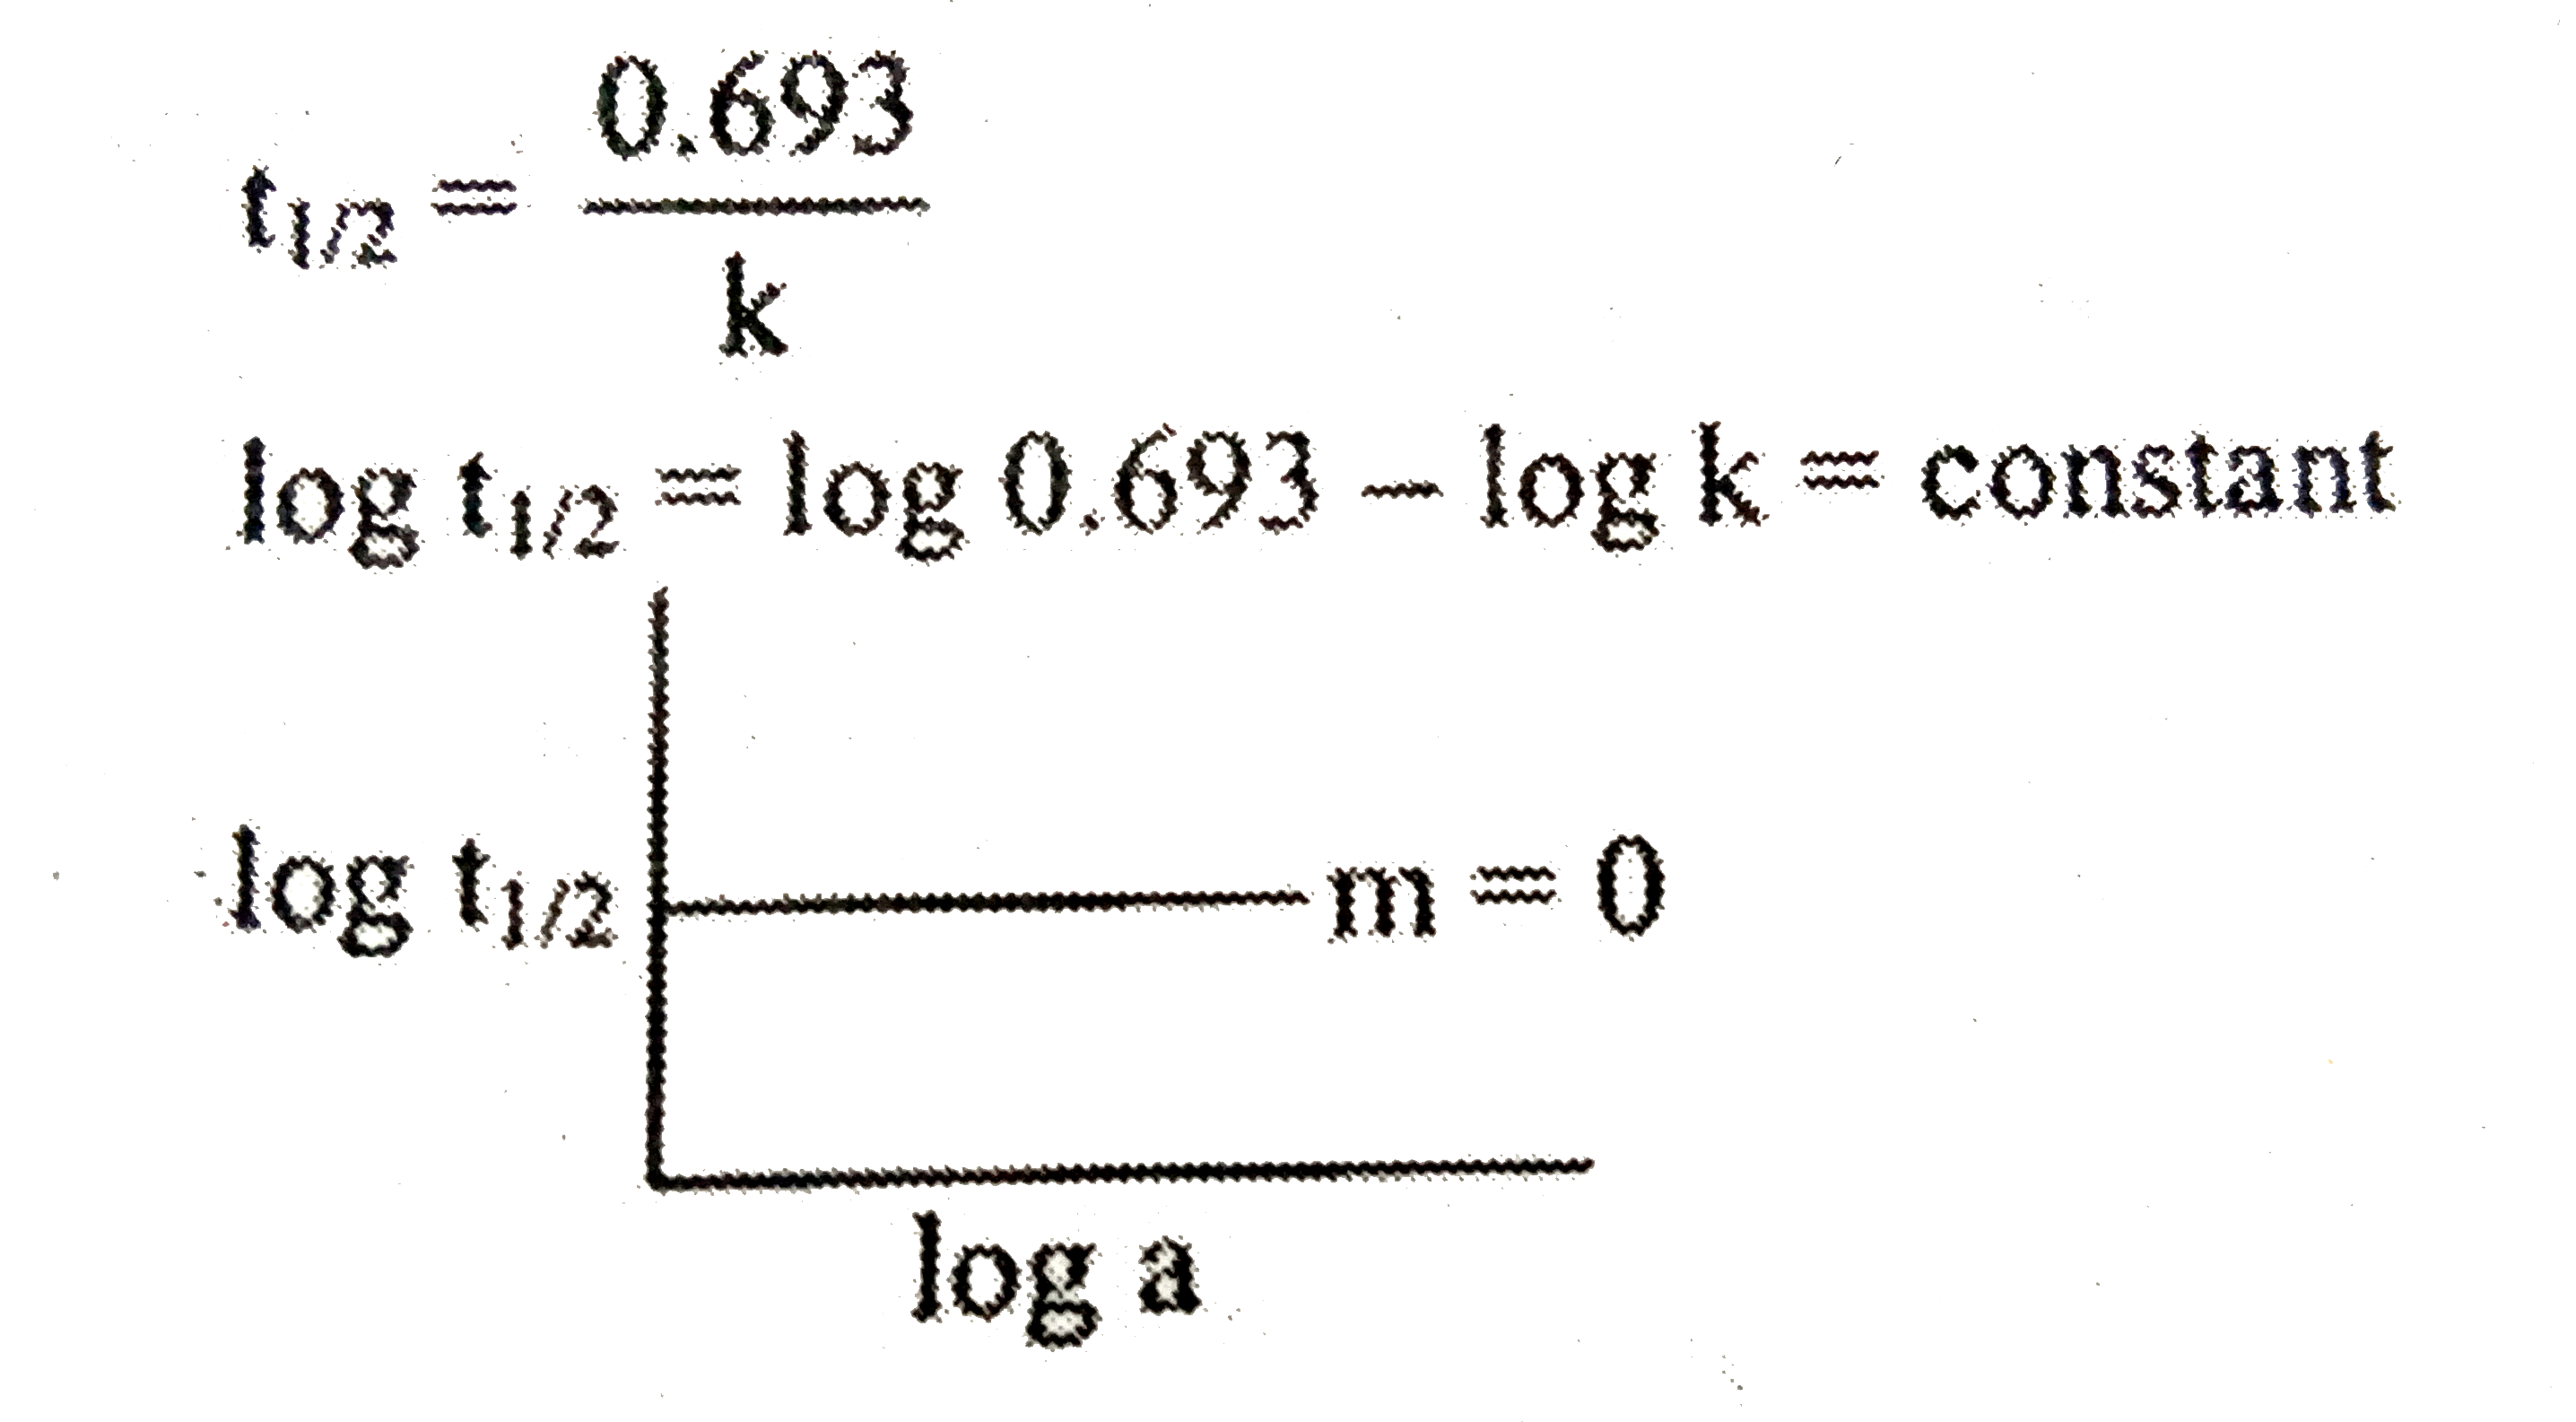
- Plotting a graph of log t(1//2) against log [A](0) of a rectant for a ...
Text Solution
|
- The rate of disappearence of SO(2) in the reaction 2SO(2)+O(2)to2SO(...
Text Solution
|
- Which of the following compound have 1^(@),2^(@), 3^(@) and 4^(@)C pre...
Text Solution
|
- Relate the following compounds
Text Solution
|
- Which has maximum b,p and m,p out of :
Text Solution
|
- Action of heat on a mixture of sodium propionate and sodalime produces...
Text Solution
|
- In which case racemisation takes place ?
Text Solution
|
- Which of the following molecule do not give Br(2)/Water test
Text Solution
|
Text Solution
|
- the reagent used for the seperation of acetaldehyde from acetophenon i...
Text Solution
|
- Which of the following is not oxidised by Aqueouis Br(2) ?
Text Solution
|
- "CC"l(4) is inert towards hydrolysis but SiCl(4) is readily hydrolysed...
Text Solution
|
- Salt P+QtoRoverset(BaCl(2))towhite ppt (P) is paramagnetic in nature...
Text Solution
|
- A square planer complex represented as :
Text Solution
|
- Three test tubes contain aqueous solutions as under I. KCN IIgt Fe...
Text Solution
|
- Which is known as blister copper ?
Text Solution
|
Text Solution
|
- The above configuration is
Text Solution
|