A
B
C
D
Text Solution
Verified by Experts
The correct Answer is:


Topper's Solved these Questions
Thermodynamics
MOTION|Exercise EXERCISE - 2|40 VideosThermodynamics
MOTION|Exercise EXERCISE - 3 SECTION - A|49 VideosThermodynamics
MOTION|Exercise Solved Example|10 VideosSURFACE TENSION & VISCOSITY
MOTION|Exercise Exercise - 4 | Level-II Previous Year | JEE Advanced|12 VideosUNIT & DIMENSIONS
MOTION|Exercise Exercise - 4 (Level - II) (PREVIOUS YEAR JEE ADVANCED)|10 Videos
Similar Questions
Explore conceptually related problems
MOTION-Thermodynamics-EXERCISE - 1
- The amount of heat required to raise the temperature of a diatomic gas...
Text Solution
|
- A gas of given mass, is brought from stage A to B along three paths 1,...
Text Solution
|
- The indicator diagrams representing minimum and maximum amounts of wor...
Text Solution
|
- A fixed mass of gas undergoes the cycle of changes represented by PQRS...
Text Solution
|
- Consider the process on a system shown in figure. During the process, ...
Text Solution
|
- An ideal system can be brought from stage A to B through four paths as...
Text Solution
|
- Ideal gas is taken through process shown in figure
Text Solution
|
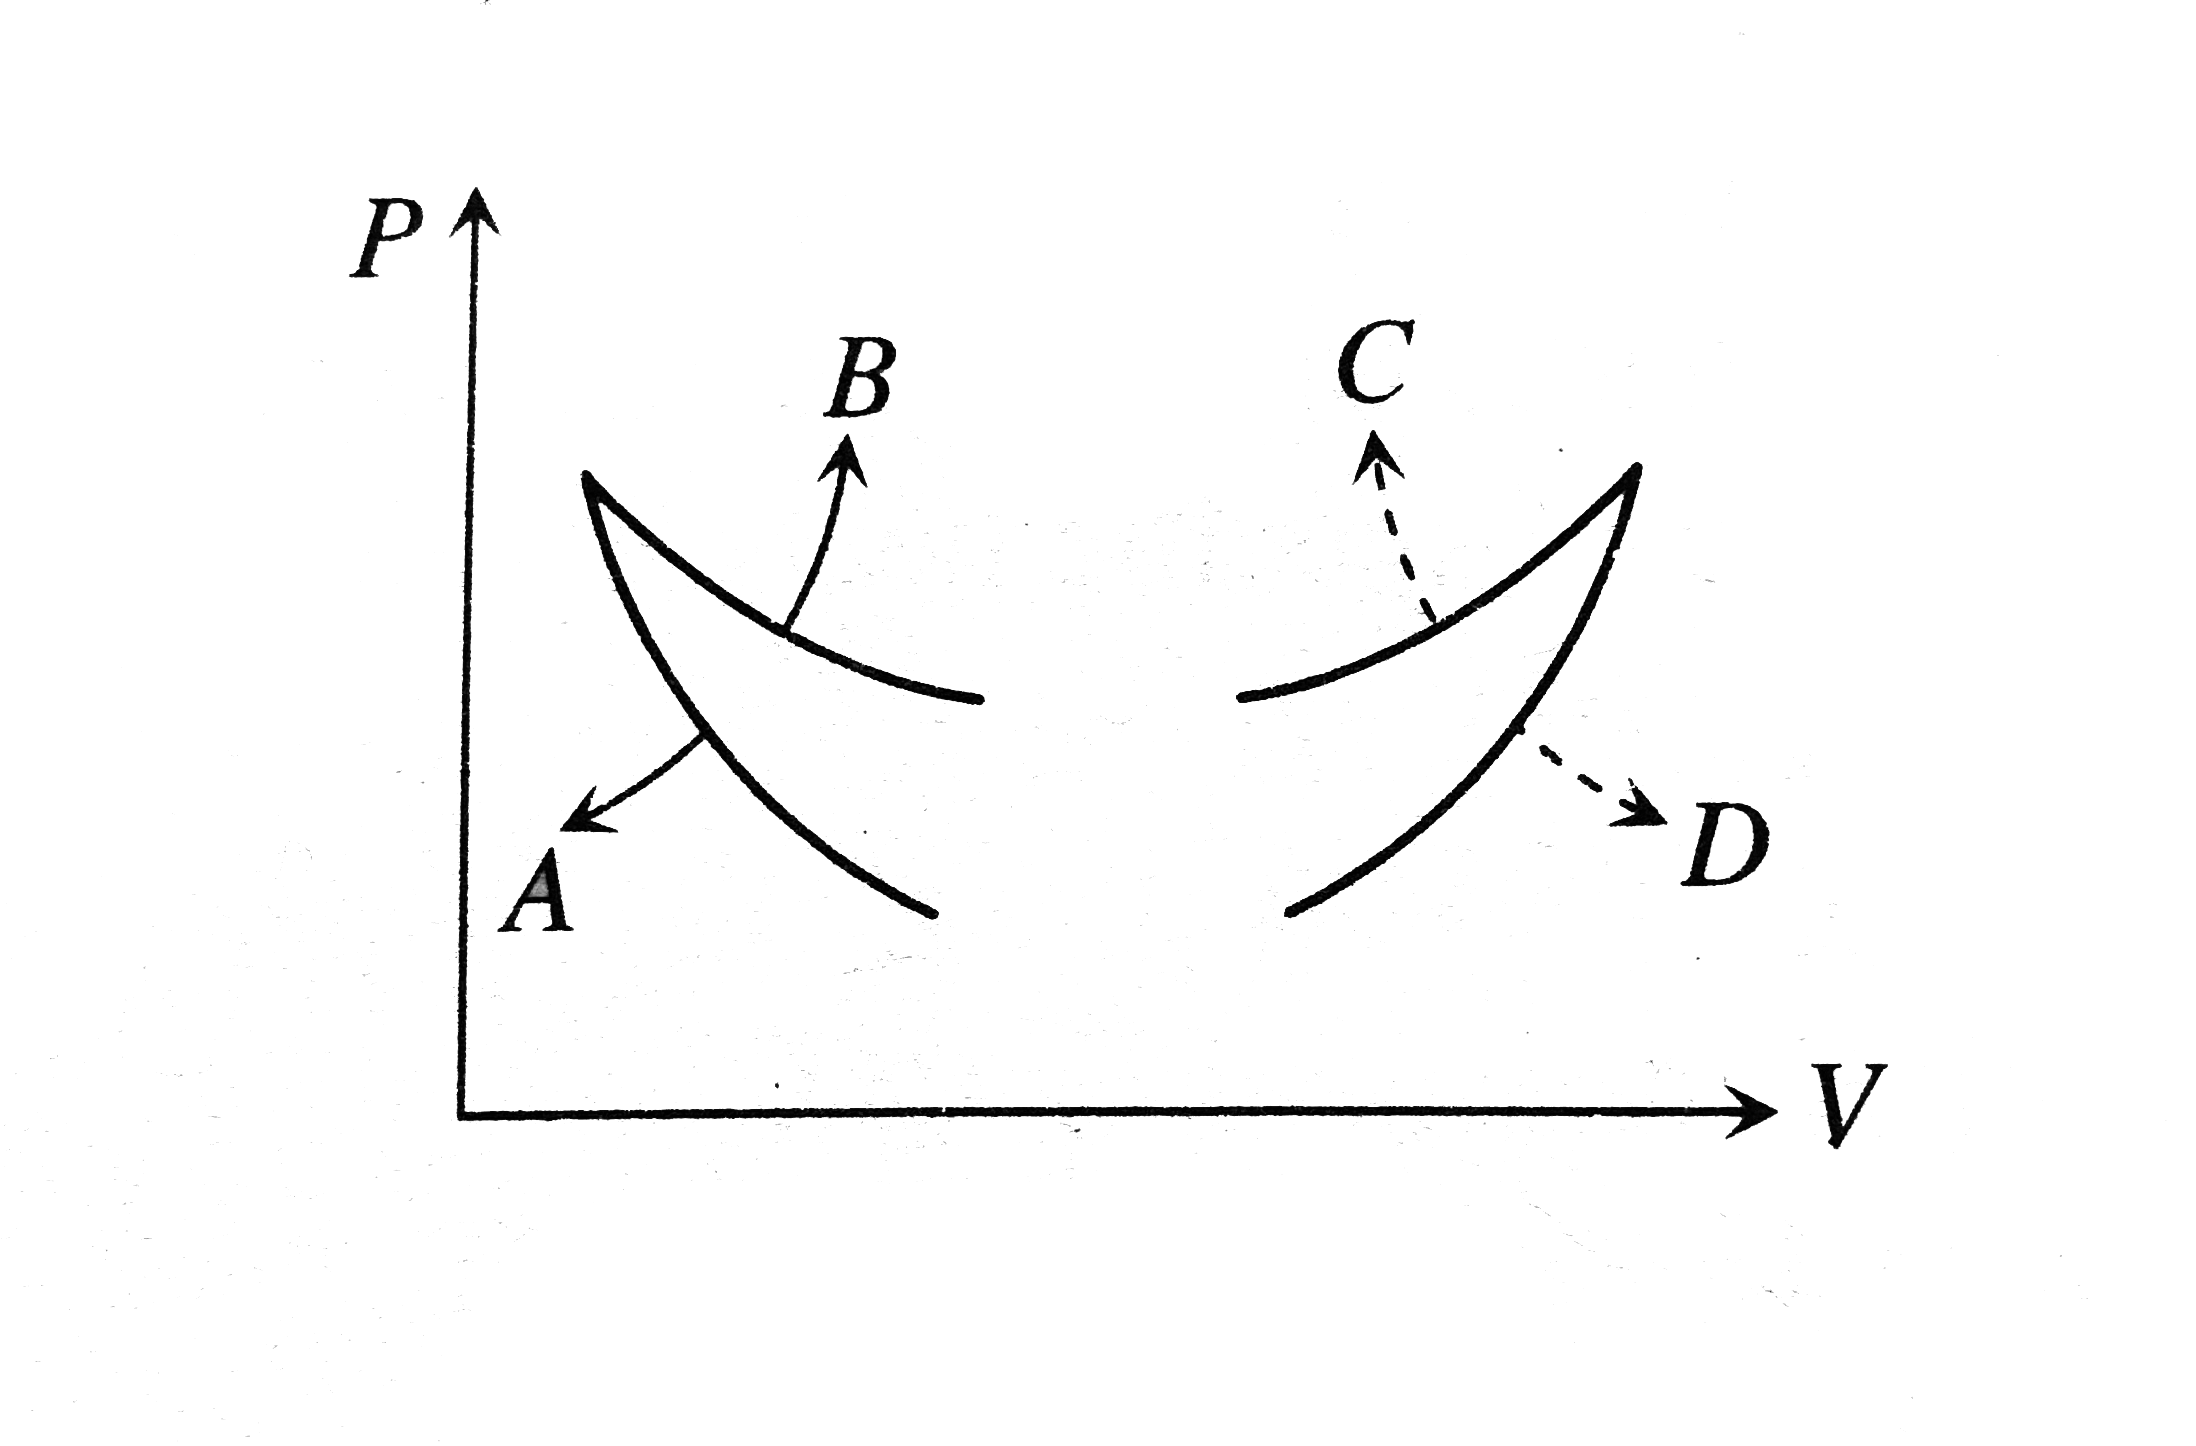
- Four curves A, B, C and D are drawn in Fig. for a given amount of gas....
Text Solution
|
- In reference of above figure, no heat exchange between the gas and the...
Text Solution
|
- Two curves are given at temperatures T(1) and T(2) in an isothermal pr...
Text Solution
|
- Three curves are shown in the P-V diagram. P, Q and R represent the pr...
Text Solution
|
- The cyclic process for 1 mole of an ideal gas is shown in the V-T diag...
Text Solution
|
- A certain mass of an ideal gas is at pressure P(1) and volume V(1). If...
Text Solution
|
- A thermodynamics cycle takes in heat energy at a high temperature and ...
Text Solution
|
- An ideal gas heat engine operates in Carnot cycle between 227^(@)C and...
Text Solution
|
- An ideal heat engine exhausting heat at 77^(@) is to have a 30% effici...
Text Solution
|
- A Carnot engine, whose sink is at 300 K, has an efficiency of 40%. By ...
Text Solution
|
- Two steam engines 'A' and 'B', have their sources respectively at 700K...
Text Solution
|
- Two steam engines 'A' and 'B', have their sources respectively at 700K...
Text Solution
|
- A Carnot engine working between K 300 and 600 K has work output of 800...
Text Solution
|