A
B
C
D
Text Solution
Verified by Experts
The correct Answer is:


Topper's Solved these Questions
ONE DIMENSION MOTION
MOTION|Exercise EXERCSE -1 (Section -D : Rain Problems, Aircraft wind problems)|6 VideosONE DIMENSION MOTION
MOTION|Exercise EXERCSE -1 (Section - E : River Boat Problems )|1 VideosONE DIMENSION MOTION
MOTION|Exercise EXERCSE -1 (Section - B : Motion under Gravity)|11 VideosNLM & FRICTION
MOTION|Exercise EXERCISE-4 ( LEVEL-II)|15 VideosOPTICS
MOTION|Exercise Exercise|45 Videos
Similar Questions
Explore conceptually related problems
MOTION-ONE DIMENSION MOTION-EXERCSE -1 (Section - C : Relative Motion)
- A train moves northwards with speed 80 km h^(-1) . While a car moves...
Text Solution
|
- A bus appears to go with a speed of 25 km/hr to a car driver, driving ...
Text Solution
|
- Two trains, each 50 m long, are travelling in opposite directions with...
Text Solution
|
- A train of 150 m length is going toward north direction at a speed of ...
Text Solution
|
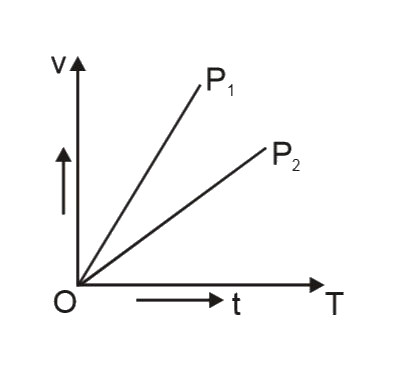
- Shown in the figure are the velocity time graphs of the two particles ...
Text Solution
|
- Shown in the figure are the displacement time graph for two children g...
Text Solution
|
- A body A is thrown vertically upwards with such a velocity that it rea...
Text Solution
|
- Which one of the following represents displacement-time graph of two o...
Text Solution
|
- Two trains A and B each of length 100 m, are moving
Text Solution
|