A
B
C
D
Text Solution
Verified by Experts
The correct Answer is:


Topper's Solved these Questions
ONE DIMENSION MOTION
MOTION|Exercise EXERCSE -2 (Section - D : Relative Motion)|3 VideosONE DIMENSION MOTION
MOTION|Exercise EXERCSE -2 (Section - E : River Boat Problems)|3 VideosONE DIMENSION MOTION
MOTION|Exercise EXERCSE -2 (Section - B : Motion under Gravity)|8 VideosNLM & FRICTION
MOTION|Exercise EXERCISE-4 ( LEVEL-II)|15 VideosOPTICS
MOTION|Exercise Exercise|45 Videos
Similar Questions
Explore conceptually related problems
MOTION-ONE DIMENSION MOTION-EXERCSE -2 (Section - C : Graphs)
- The displacement of a particle as a function of time is shown in figur...
Text Solution
|
- v-t graph of an object of mass 1 kg is shown. Select the wrong stateme...
Text Solution
|
- A ball is dropped from certain height on a glass floor so that it rebo...
Text Solution
|
- The acceleration of a particle which moves along the positive x-axis v...
Text Solution
|
- The figure shows a velocity-time graph of a particle moving along a st...
Text Solution
|
- The figure shows a velocity-time graph of a particle moving along a st...
Text Solution
|
- The figure shows a velocity-time graph of a particle moving along a st...
Text Solution
|
- The figure shows a velocity-time graph of a particle moving along a st...
Text Solution
|
- The figure shows a velocity-time graph of a particle moving along a st...
Text Solution
|
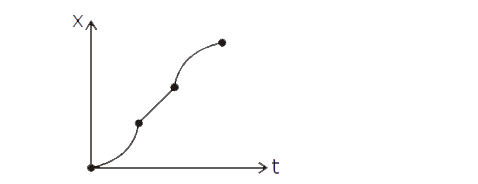
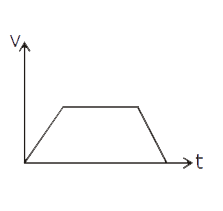
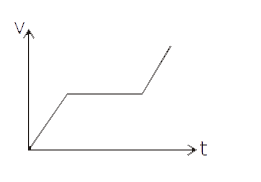
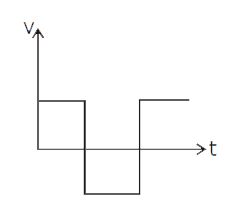
- Find the correct v-t graph for the shown x-t graph (displacement-time)...
Text Solution
|
- A particle is moving on a straight line such that square of its veloci...
Text Solution
|
- Position time graph of a particle moving along straight line is shown ...
Text Solution
|