


NTA MOCK TESTS-NTA JEE MOCK TEST 36-PHYSICS
- A system of two identical, uniform discs with identical circular cavit...
Text Solution
|
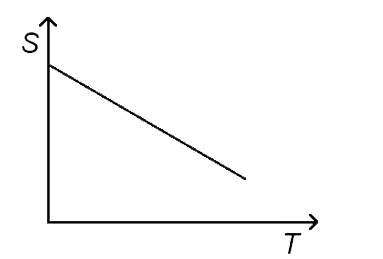
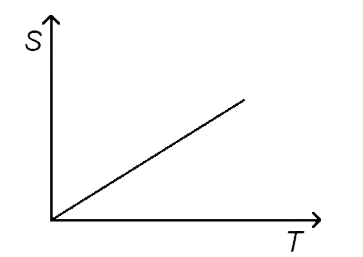
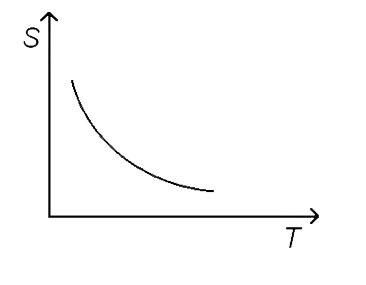
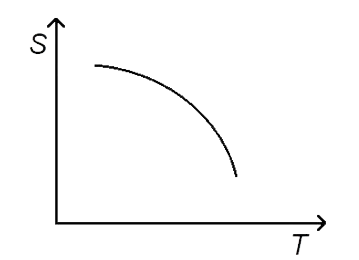
- The correct graph which shows the variation of paramagnetic susceptibi...
Text Solution
|
- In the given figure, if i(1)=3 sin omegat and i(2)=4 cos t, then i(3) ...
Text Solution
|
- In a uniform magneitc field of induced B a wire in the form of a semic...
Text Solution
|
- The potnetial at point A, in the circuit, is (Point N is grounded, i.e...
Text Solution
|
- A satellite of mass m orbits around the Earth of mas M in an elliptica...
Text Solution
|
- The amount of heat energy required to freeze 4.5 g of water of 6^(@)C...
Text Solution
|
- An ideal gas (gamma = 1.5) undergoes a thermodynamic process in which ...
Text Solution
|
- One of the two identical conducting wires of length L is bent in the f...
Text Solution
|
- Half-life of radioactive sample, when activity of material initially w...
Text Solution
|
- The time period of a spring - mass system is T. If this spring is cut ...
Text Solution
|
- Two soap bubble are combined isothermally to form a big bubble of radi...
Text Solution
|
- A cylindrical tube filled with water (mu(w)=(4)/(3)) is closed at its ...
Text Solution
|
- A transistor connected in common emitter configuration has input resis...
Text Solution
|
- A clock which keeps correct time at 20^(@)C is subjected to 40^(@)C. I...
Text Solution
|
- The density of a cube is measured by measuring its mass and length of ...
Text Solution
|
- In a Young's double slit experiment, the slit separation is 1mm and th...
Text Solution
|
- Two coherent sound sources A and B produce a sound of wavelength lambd...
Text Solution
|
- Two particles of same mass m moving with velocities u(1) and u(2) coll...
Text Solution
|
- A car is travelling at a velocity "10 km h"^(-1) on a straight road. T...
Text Solution
|