A
B
C
D
Text Solution
Verified by Experts
The correct Answer is:


Topper's Solved these Questions
Similar Questions
Explore conceptually related problems
NTA MOCK TESTS-NTA JEE MOCK TEST 64-CHEMISTRY
- Match the column I with column II and mark the appropriate choice.
Text Solution
|
- An electric charge of 5 Faradays is passed through three electrolytes...
Text Solution
|
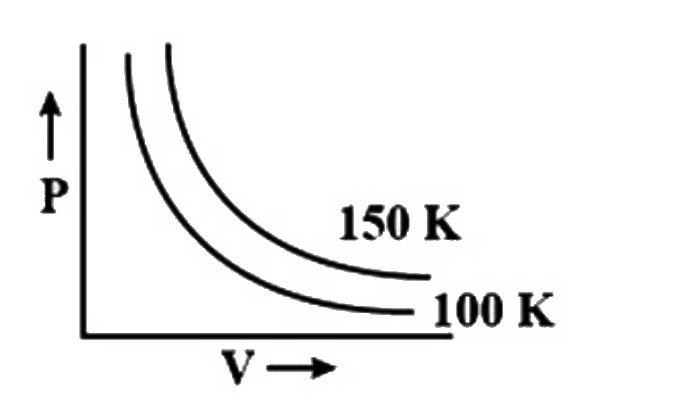
- A graph is plotted between pressure and volume at different temperatur...
Text Solution
|
- Which of the following alkyl halides is hydrolysed by S(N^(1)) mechani...
Text Solution
|
- Identify (X), (Y) and (Z) in the given reaction. CH(3)COCH(3) overse...
Text Solution
|
- A compound C(6)H(14)O(2) has two tertiary alcoholic groups . The IUPAC...
Text Solution
|
- When a plot between logk and 1/T is plotted we get the graph as shown....
Text Solution
|
- During the formation of the slag by the reaction of flux and impuritie...
Text Solution
|
- Fill in the reagents for the given conversion : CH(3)COCl overset((...
Text Solution
|
- Match the column I with column II and mark the appropriate choice.
Text Solution
|
- Which of the following azeotropes is not correctly matched?
Text Solution
|
- A translucent white waxy solid (A) reacts with excess of chlorine to g...
Text Solution
|
- A metal (M) produces a gas (N) on reaction with alkalies like NaOH and...
Text Solution
|
- Match the column I with column II and mark the appropriate choice.
Text Solution
|
- Which of the following satements is not correct?
Text Solution
|
- How many positional isomers are possible for this compound
Text Solution
|
- If in I(2)Cl(6) the number of covalent bonds and coordinate bonds are ...
Text Solution
|
- Here the sum of X+Y is equal to
Text Solution
|
- The number of possible sterio isomers in Ma(3)b(3) is equal to (Here...
Text Solution
|
- The pK(a) of acetic acid and pK(b) of NH(4)OH are 4.75 and 4.75 respec...
Text Solution
|