Home
Class 12
BIOLOGY
Figure given below shows three velocity...

Figure given below shows three velocity-substrate concentration curves for an enzyme reaxtion. What do the curves for an enzyme reaction. What do the curves depict

A

A - normal enzyme reaction , B - competitive inhibition , C - non - competitive inhibition

B

A - enzyme with an allosteric modulator added , B - normal enzyme activity , C - competitive inhibition

C

A - enzyme with an allosteric stimulator , B - competitive inhibitor added , C - normal enzyme reaction

D

A - normal enzyme reaction , B - non - competitive inhibition , C - allosteric inhibitor added

Text Solution

Verified by Experts

The correct Answer is:
A
Promotional Banner

Topper's Solved these Questions

  • NTA NEET SET 59

    NTA MOCK TESTS|Exercise BIOLOGY|90 Videos
  • NTA NEET SET 61

    NTA MOCK TESTS|Exercise BIOLOGY|90 Videos

Similar Questions

Explore conceptually related problems

The Given figure shows three velocity-substrate concentration curves of an enzyme reaction. What do the curves X Y and Z depict respectively ?

The graph given below shows the effect of substrate concentration on the rate of reaction of the enzyme green-gram-phosphatase What does the graph indicates?

What enzymes do for a biochemical reaction

The given graph shows the effect of substrate concentration on the rate of reaction of the enzyme green gram-phosphatase What dose the graph indicate

The given graph shows the effect of substrate concentration on the rate of reaction of the enzymes green gram-phosphatase. What does the graph indicate ?

The substrate concentration at which the chemical reaction catalyzed by an enzyme attains half of its maximum velocity is termed as

The figure given below shows the conversion of a substrate into product by an enzyme. In which one of the four options (a-d) the components of reaction labelled as A, B, C and D are identified correctly

NTA MOCK TESTS-NTA NEET SET 60-BIOLOGY
  1. The Golgi complex plays a major role

    Text Solution

    |

  2. Given below is a diagrammatic cross - section of single loop of the hu...

    Text Solution

    |

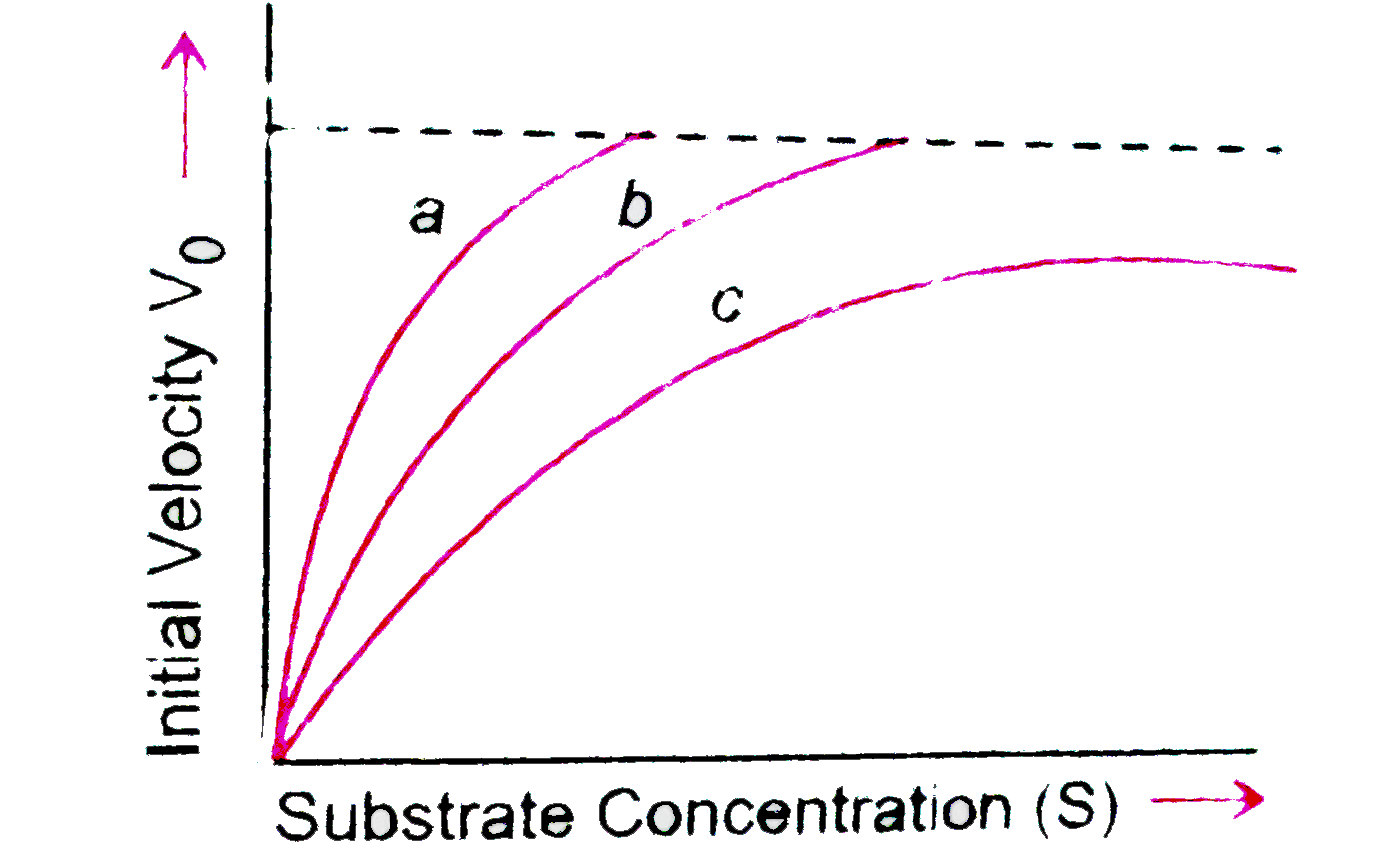
  3. Figure given below shows three velocity-substrate concentration curv...

    Text Solution

    |

  4. Given below is a list of features found in a specific tissue. (a) un...

    Text Solution

    |

  5. Which one of the following statements is incorrect ?

    Text Solution

    |

  6. Which cells in our body exhibit amoeboid movements ?

    Text Solution

    |

  7. Substrate and product are stable in any enzyme - catalysed reaction. T...

    Text Solution

    |

  8. Which of the following is not the example of synovial joint?

    Text Solution

    |

  9. Select the correct matching: {:(,"Column: I",,"Column: II"),(A,"G1 P...

    Text Solution

    |

  10. Which of the following glands consists of two lobes , interconnected w...

    Text Solution

    |

  11. As compared to meiosis , in mitosis

    Text Solution

    |

  12. If the pituitary gland of an adult rat is surgically removed, which of...

    Text Solution

    |

  13. Which of the following is metabolic antitranspirants ?

    Text Solution

    |

  14. Identify the cross-sectional view of the loose connective tissue given...

    Text Solution

    |

  15. Study the following table showing the components of water potential in...

    Text Solution

    |

  16. Match the column I with column II and choose the correct option

    Text Solution

    |

  17. Which of the following mineral deficiencies will cause death of stem a...

    Text Solution

    |

  18. In sugarcane plant , which of the following enzymes is responsible for...

    Text Solution

    |

  19. MTP Act is associated with

    Text Solution

    |

  20. In the given chart of photophosphorylation, what does 'A' represent?

    Text Solution

    |