Text Solution
Verified by Experts


Topper's Solved these Questions
Similar Questions
Explore conceptually related problems
NCERT EXEMPLAR-STATISTICS AND PROBABILITY-LONG ASWERS QUESTIONS
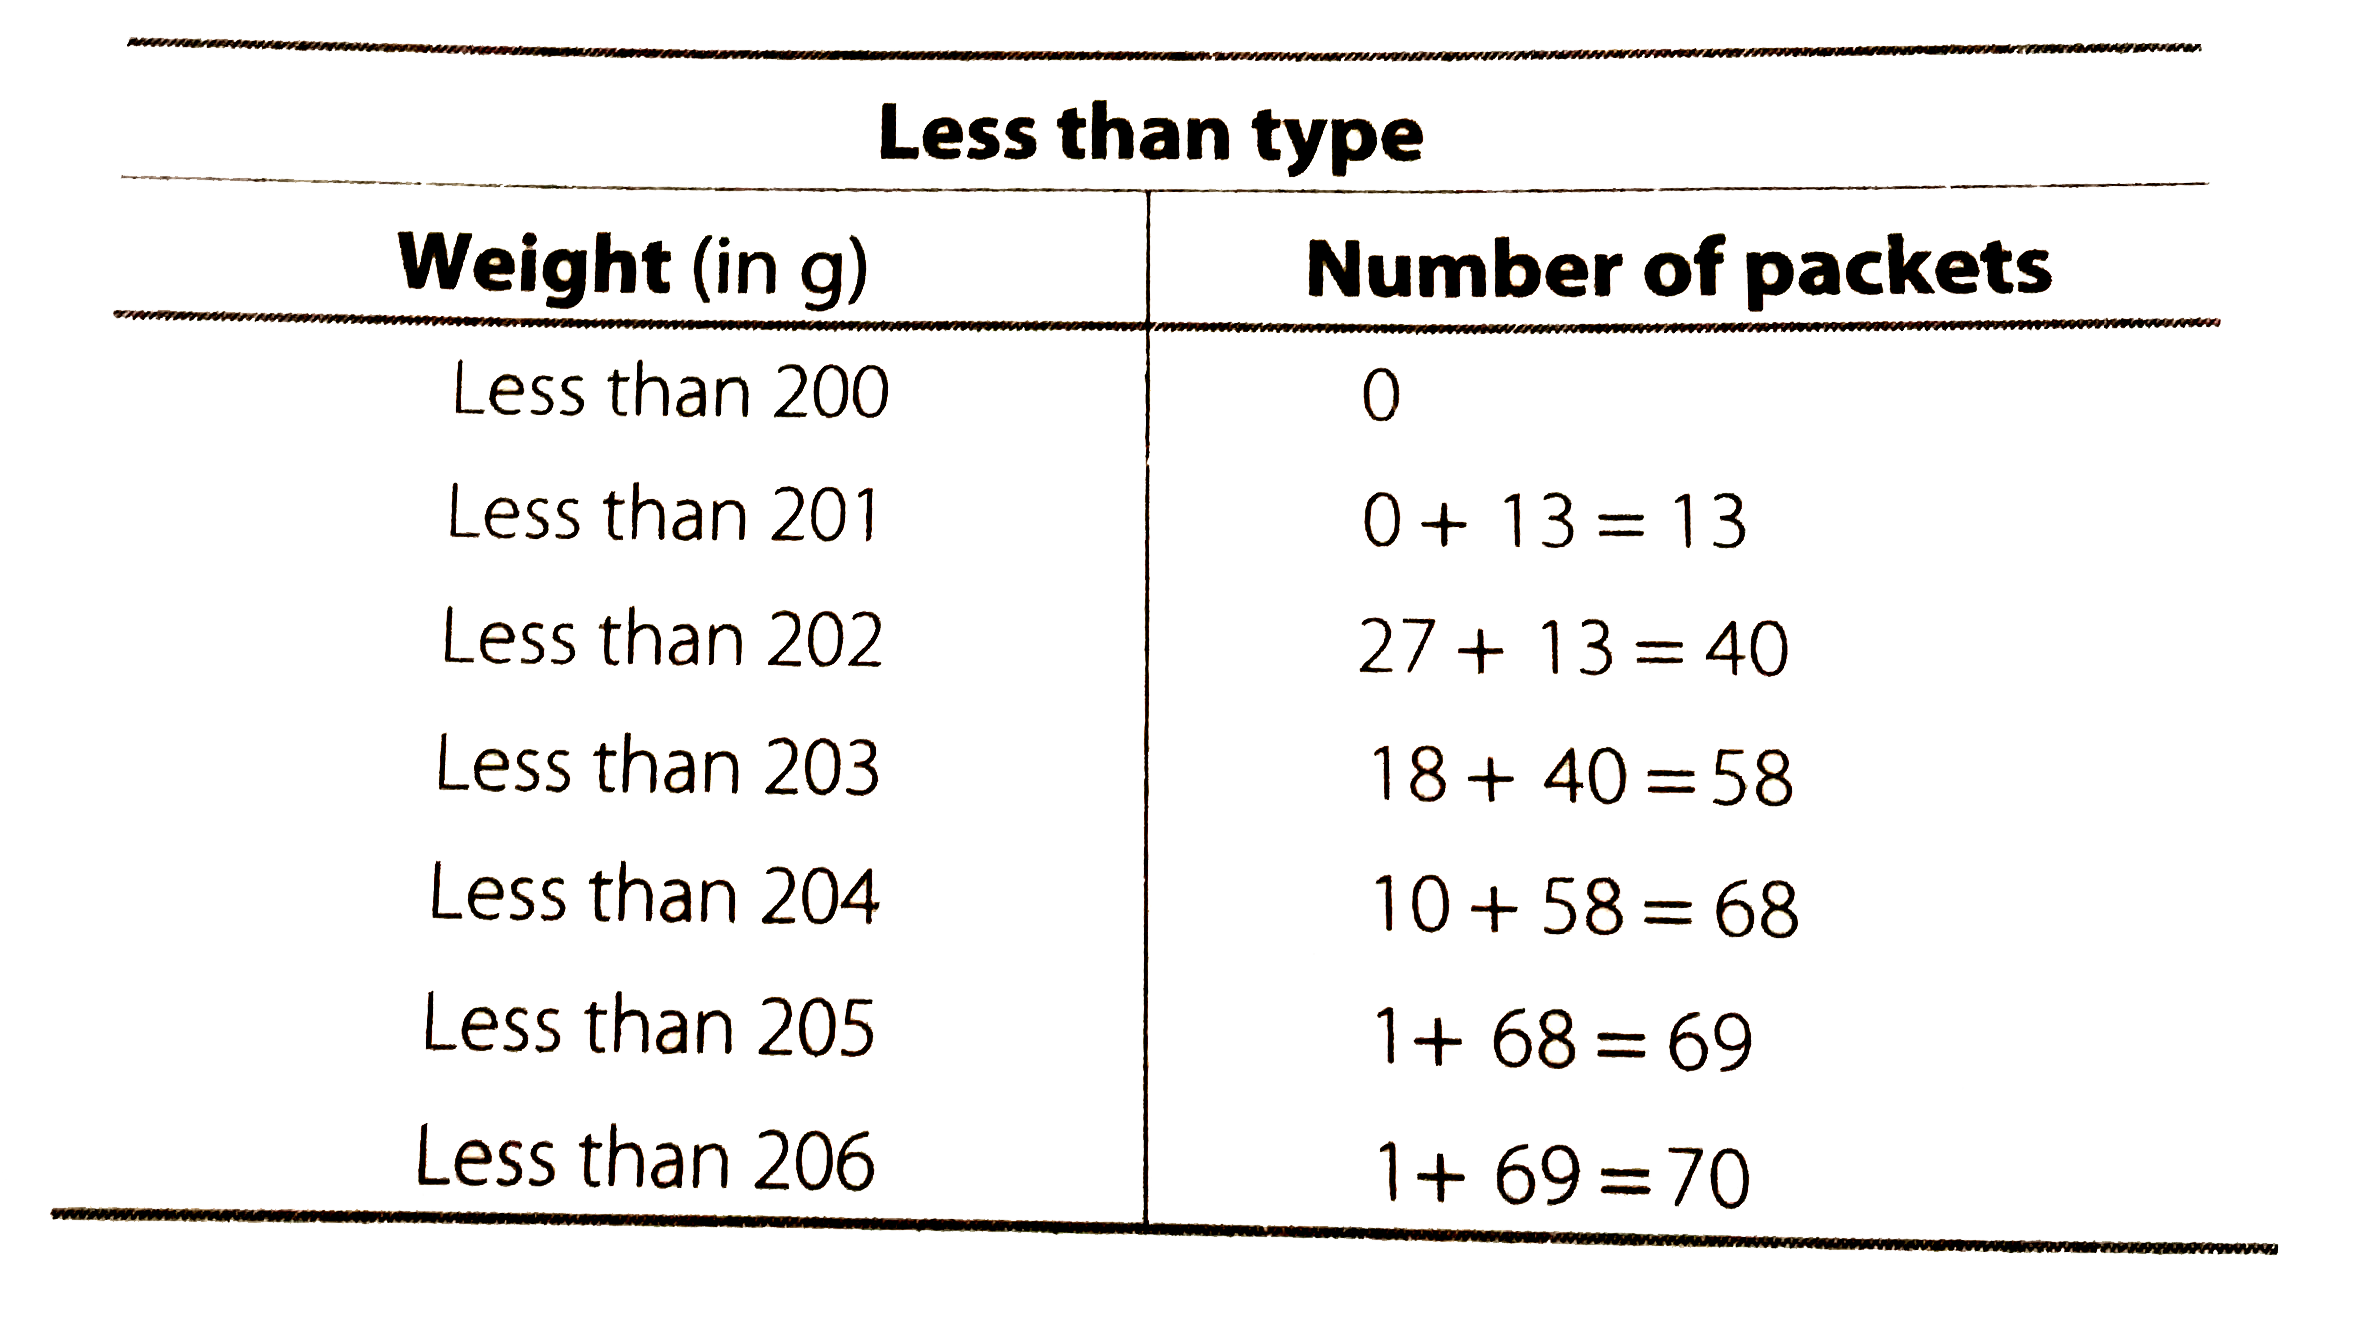
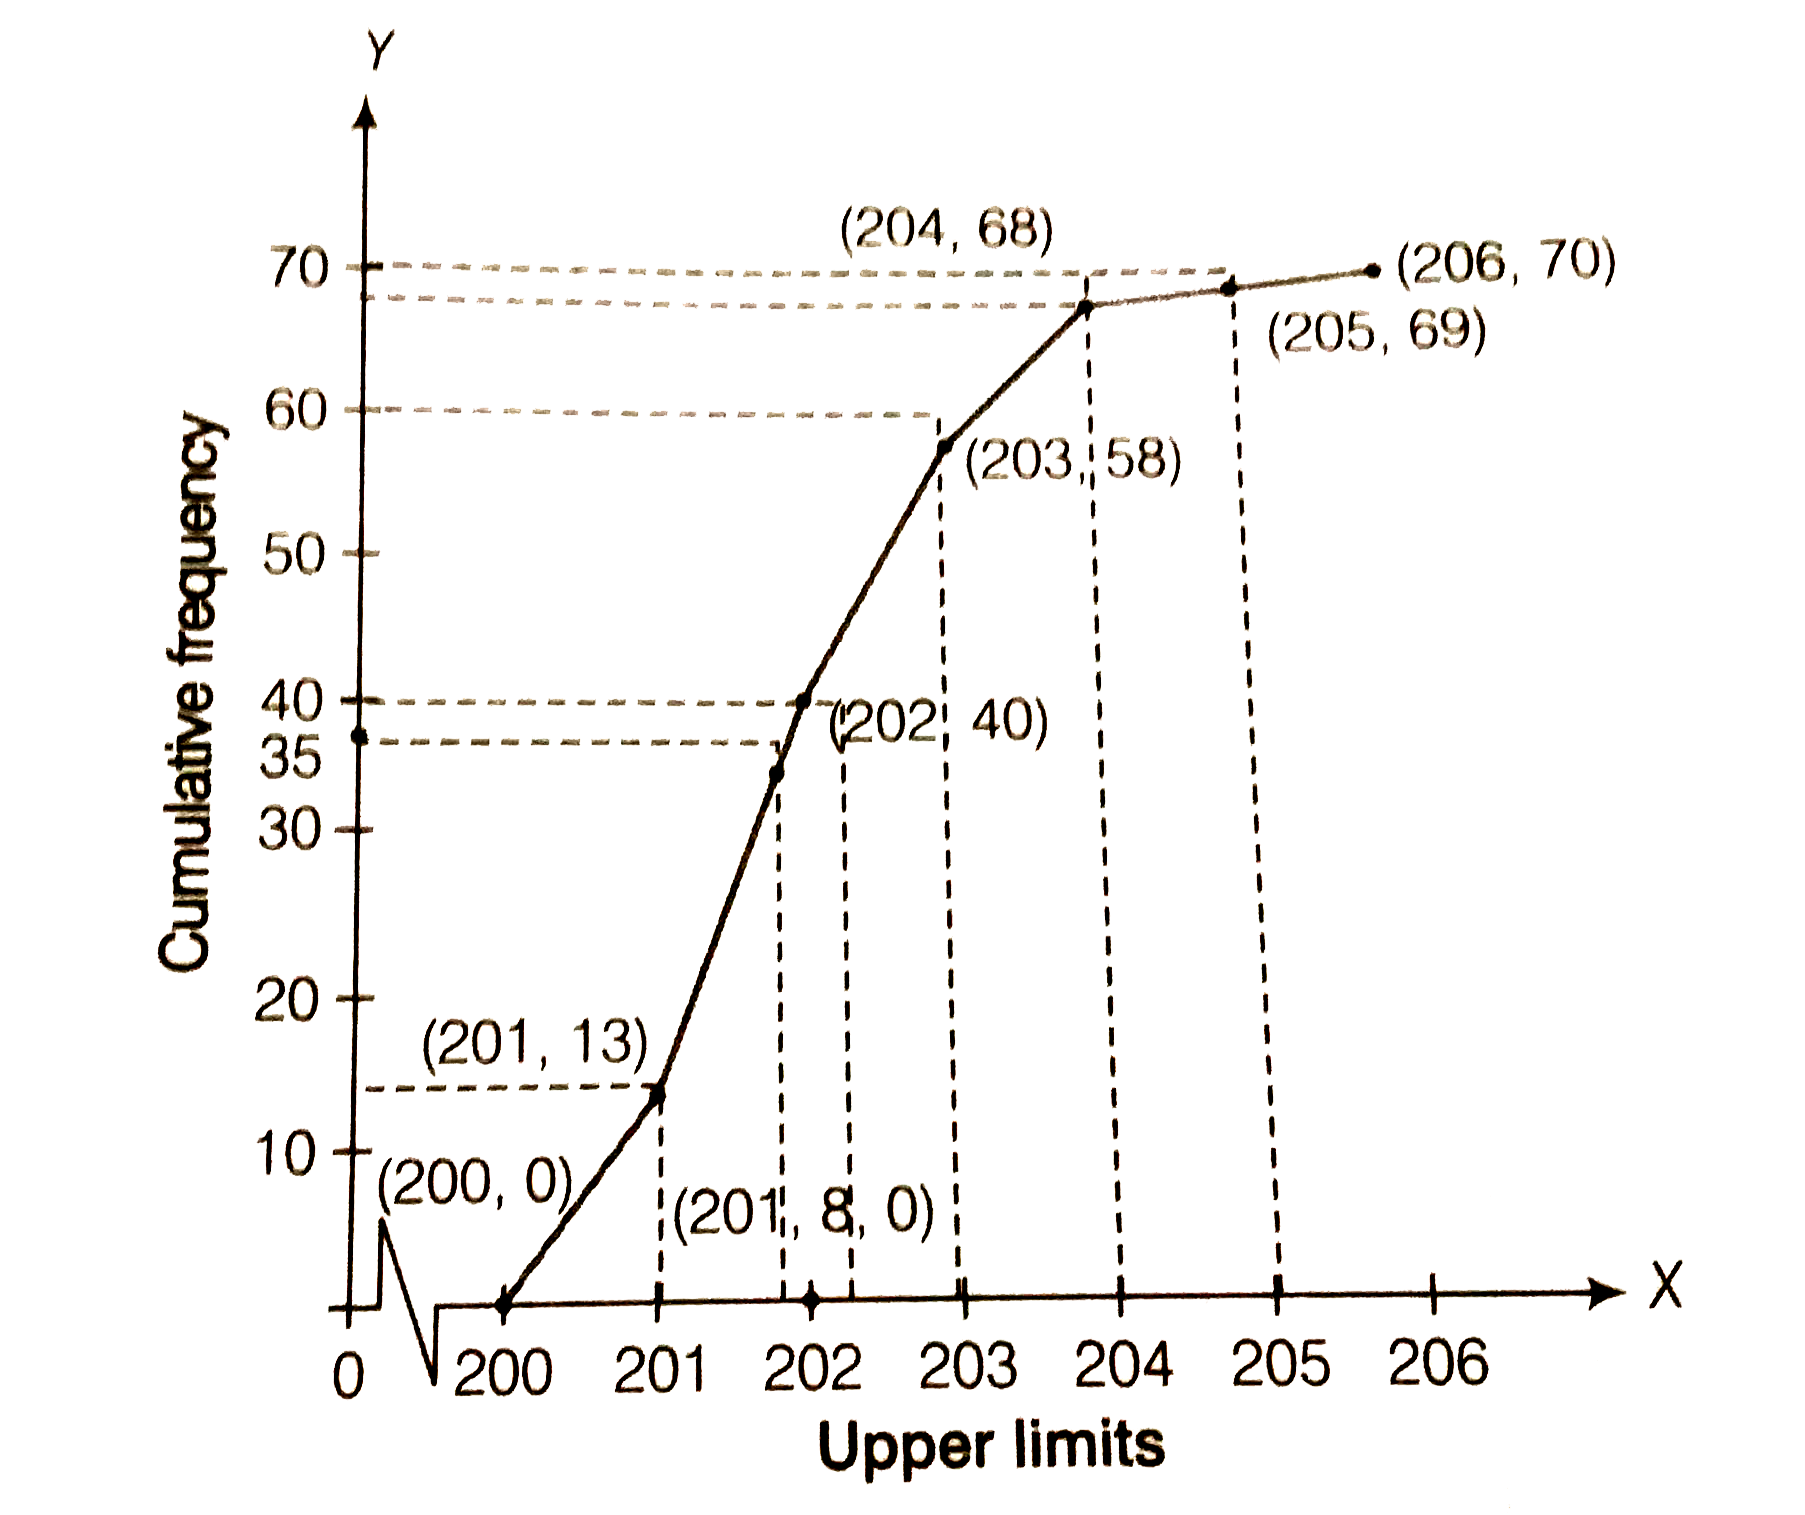
- Refer to 0.4 above. Draw the less then type ogive for this data and us...
Text Solution
|
- Refer to 0.5 above. Draw the less then type ogive for this data and us...
Text Solution
|
- The distribution of heights (in cm) of 96 children is given below ...
Text Solution
|
- The annual rainful recored of a city for 66 day is given in the follow...
Text Solution
|
- The following is the frequency distribution of duration for 100 calls ...
Text Solution
|