A
B
C
D
Text Solution
Verified by Experts
The correct Answer is:


Topper's Solved these Questions
Similar Questions
Explore conceptually related problems
KVPY PREVIOUS YEAR-KVPY-PART II BIOLOGY
- Following the cell cycle scheme given below, what is the probaility th...
Text Solution
|
- A flower with Tt genotype is cros-pollinated by TT pollens. What will...
Text Solution
|
- A new life from discovered on a distant planet has a genetic code cons...
Text Solution
|
- A spontaneous mutation results in a couple having only female progeny...
Text Solution
|
- A circular plasmid of 10,000 base pairs (bp) is digested with two rest...
Text Solution
|
- After meiosis-II daughter cells differ from the parent cells and each ...
Text Solution
|
- A desert lizard (an ectotherm ) and a mouse (an endotherm) are place...
Text Solution
|
- In Griffith's experiments mice died when injected with-
Text Solution
|
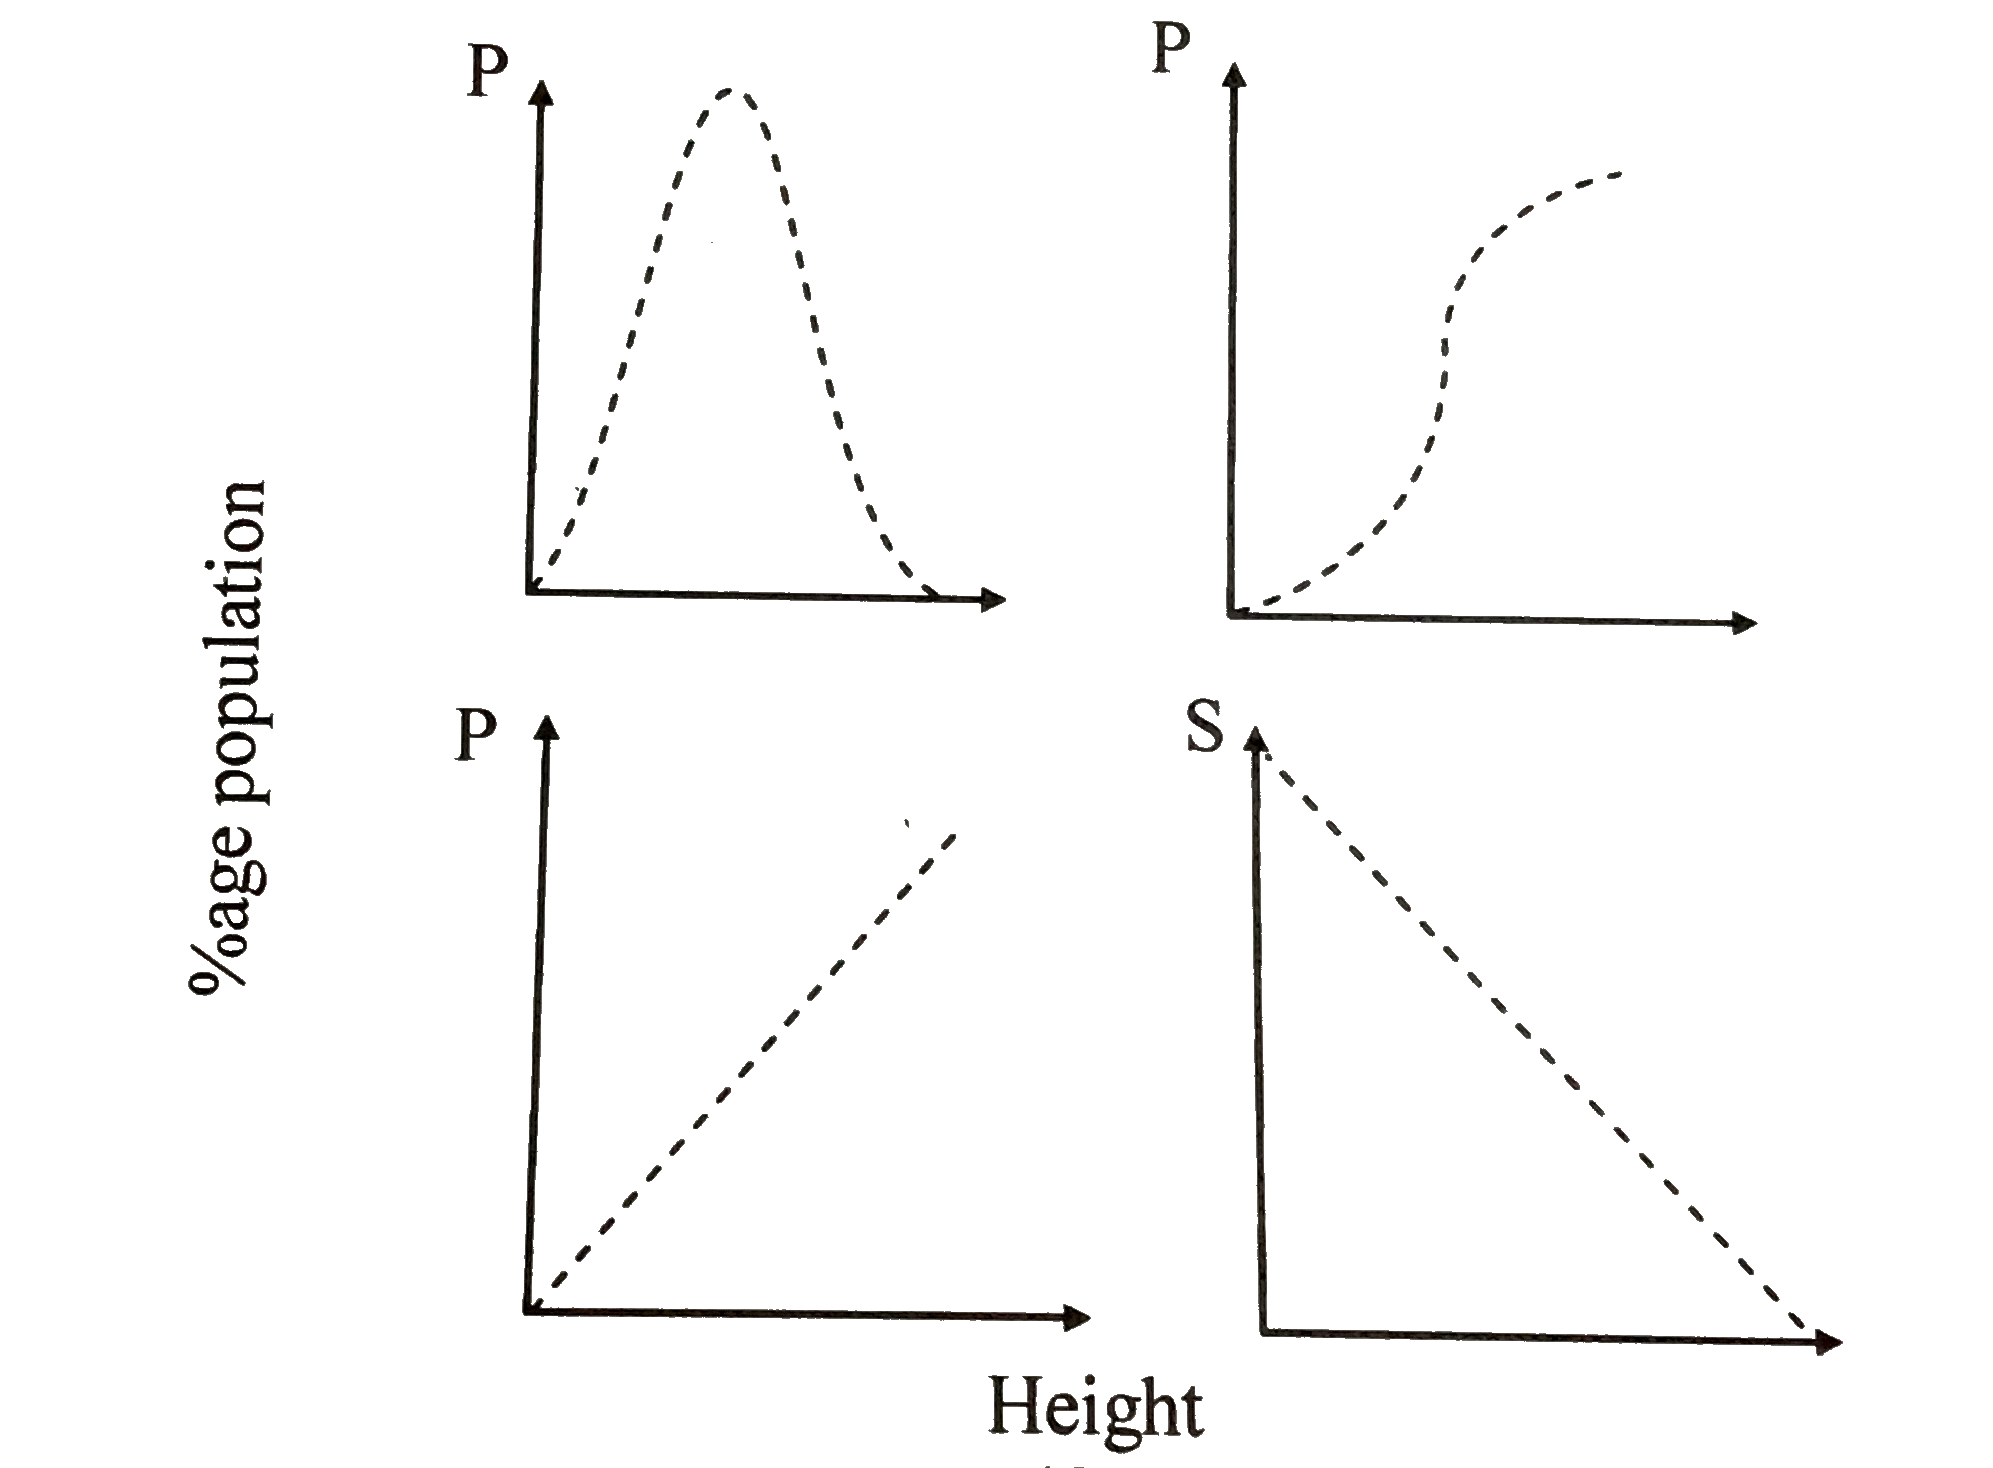
- Human height is a multigenic character. If the heights of all the indi...
Text Solution
|
- Mitochondria synthesizes ATP based on chemiosmosis when mitochondria i...
Text Solution
|