A
B
C
D
Text Solution
Verified by Experts
The correct Answer is:


Similar Questions
Explore conceptually related problems
Recommended Questions
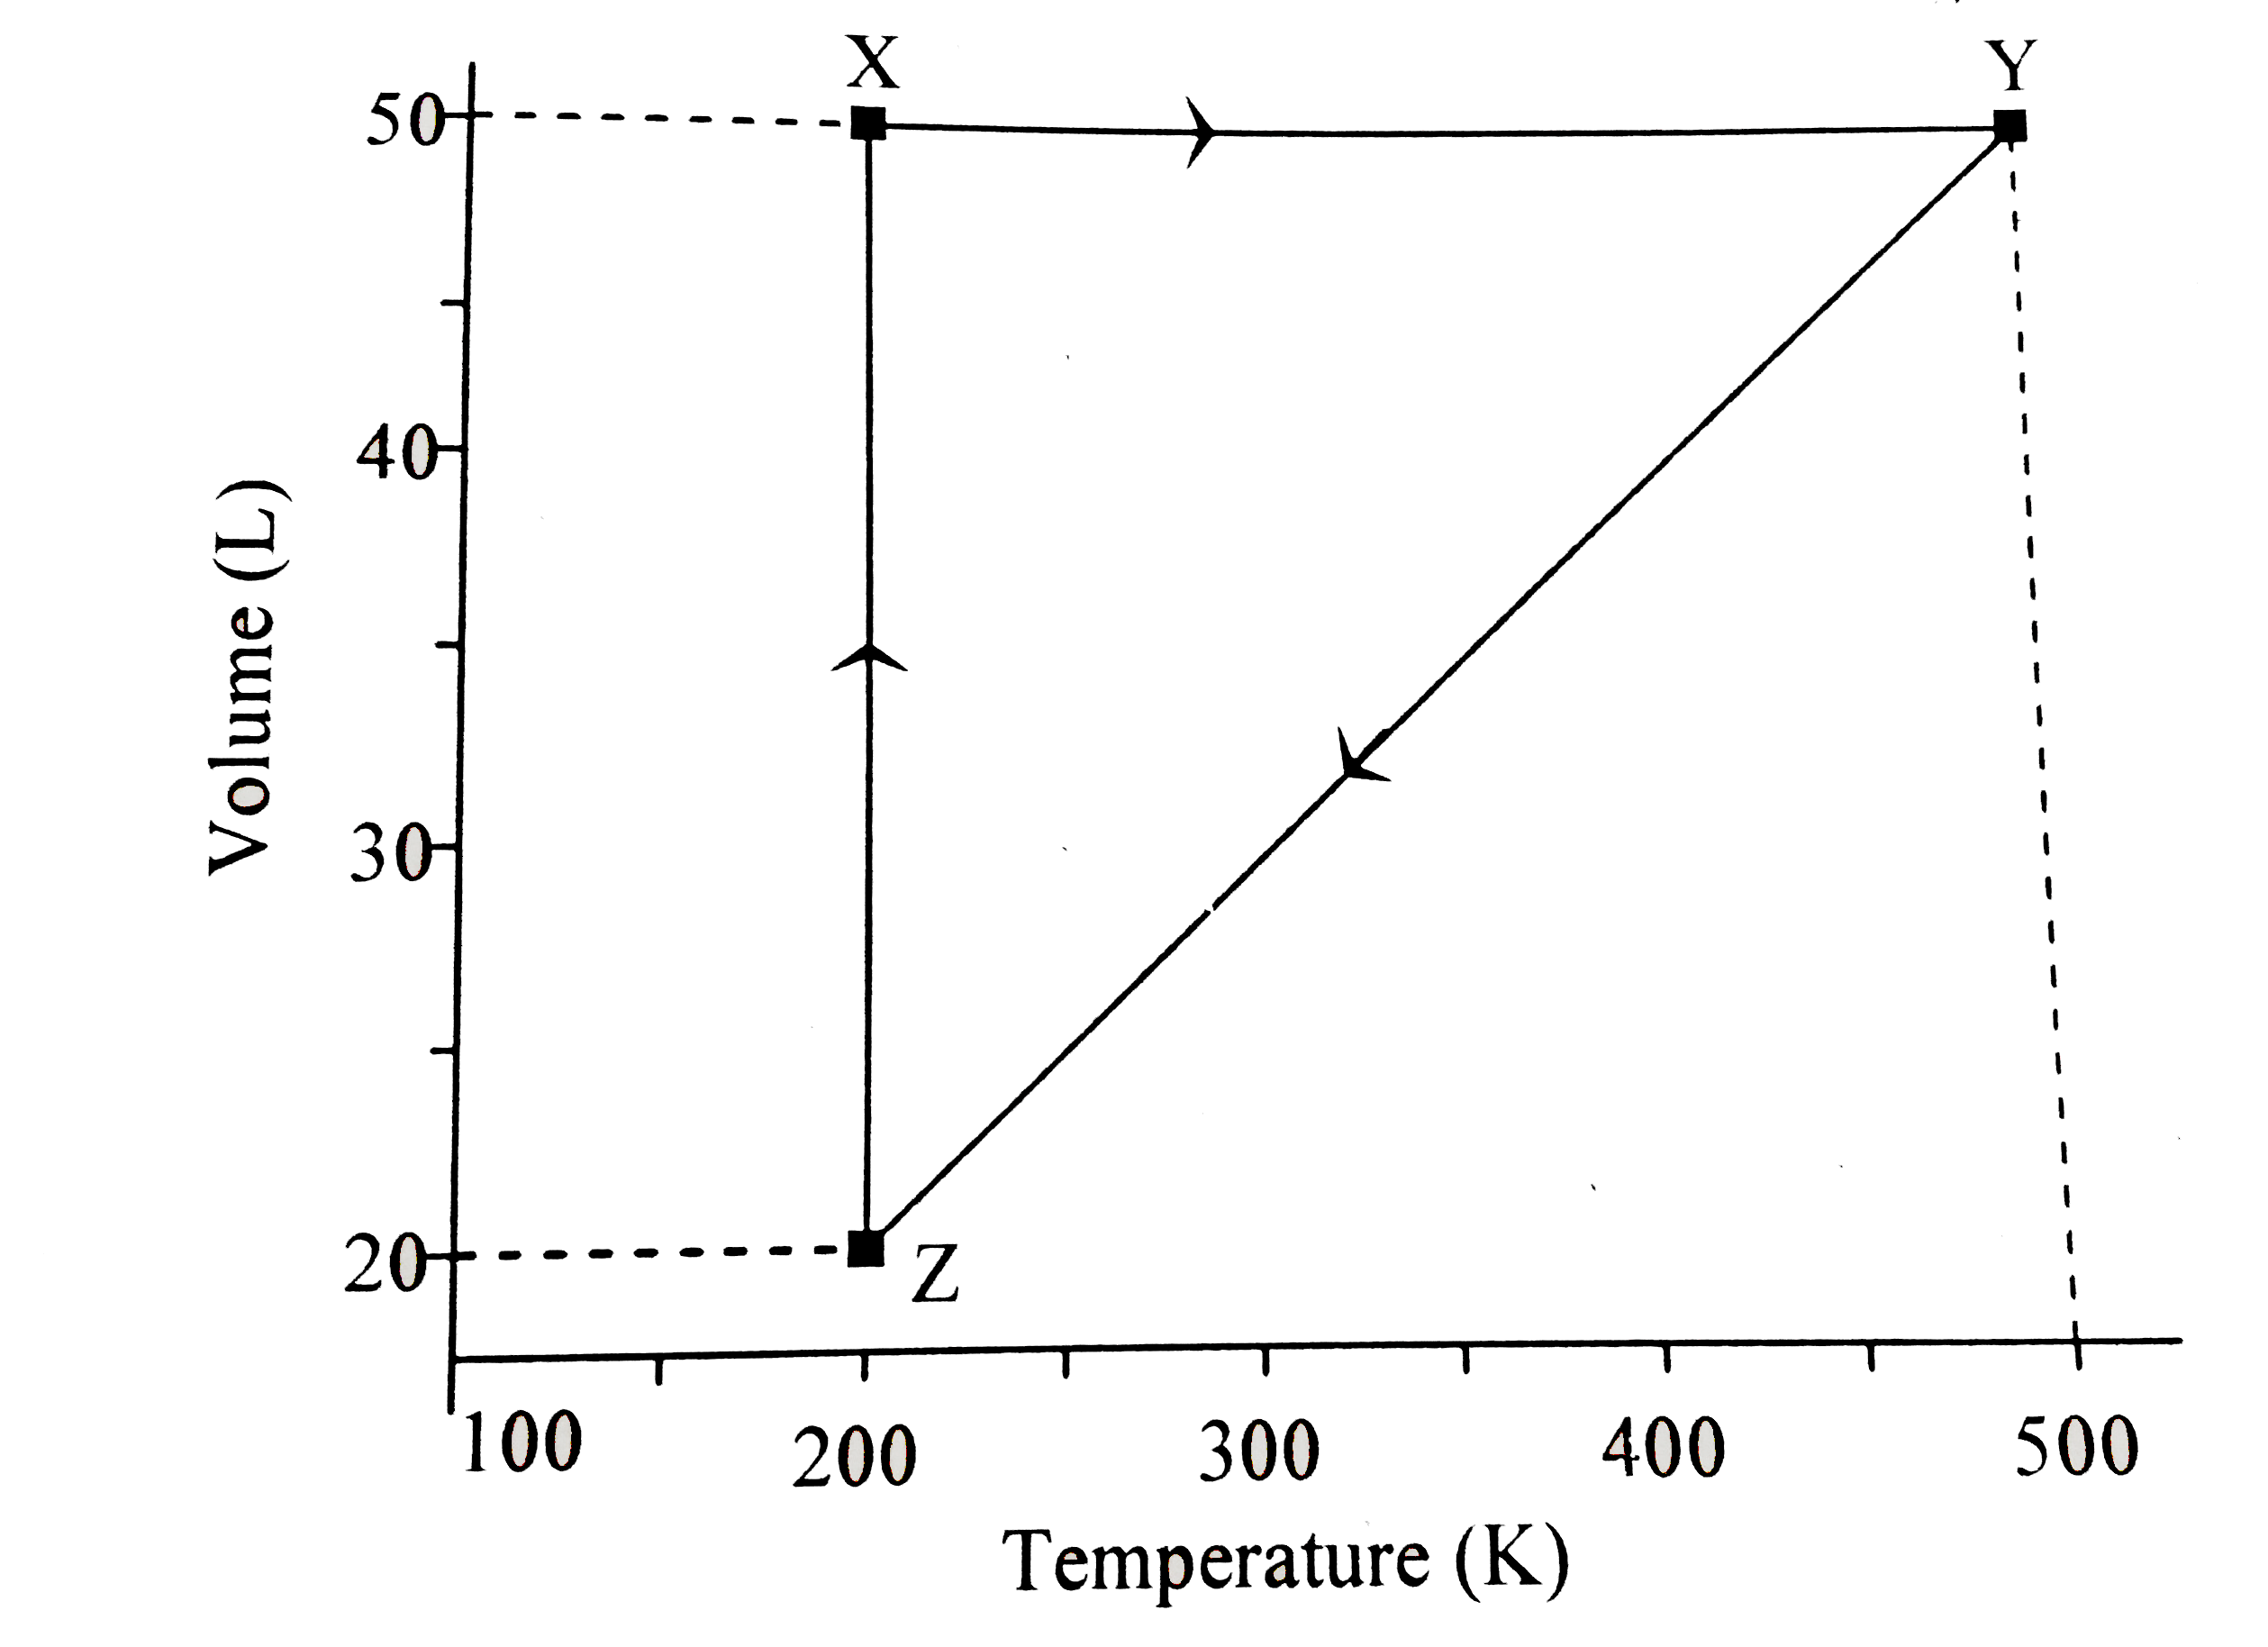
- The volume vs. temperature graph of 1 mole of an ideal gas is given be...
Text Solution
|
- Calculate the moles of an ideal gas at pressure 2 atm and volume 1 L a...
Text Solution
|
- For 1 mole of an ideal gas, a graph of pressure vs volume is plotted a...
Text Solution
|
- For 1 mole of an ideal gas, a graph of pressure vs volume is plotted a...
Text Solution
|
- The volume vs. temperature graph of 1 mole of an ideal gas is given be...
Text Solution
|
- The volume-temperature graphs of a given mass of an ideal gas at const...
Text Solution
|
- Volume of a given mass of an ideal gas is VL at 27^(@)C and 1 atm pres...
Text Solution
|
- In the show indicator diagram over pressure - volume scales 'n' moles ...
Text Solution
|
- Draw z vs PO graph for an ideal gas, and CO(2) gas
Text Solution
|