
A
B
C
D
Text Solution
Verified by Experts
The correct Answer is:


Topper's Solved these Questions
BIOMOLECULES
A2Z|Exercise Section -c Previous Years Examination Questions (aiims Question)|20 VideosBIOMOLECULES
A2Z|Exercise Section -c Previous Years Examination Questions (assertion And Reason Type Questions)|8 VideosBIOMOLECULES
A2Z|Exercise Section -b Assertion And Reason Question|11 VideosBIOLOGICAL CLASSIFICATION
A2Z|Exercise Mock Test Assertion - Reasoning Question|5 VideosBODY FLUIDS AND CIRCULATION
A2Z|Exercise Section D: Chapter-end Test|50 Videos
Similar Questions
Explore conceptually related problems
A2Z-BIOMOLECULES-Section -c Previous Years Examination Questions (neet/aipmt Questions)
- Protein quality depends upon
Text Solution
|
- Prostaglandins are
Text Solution
|
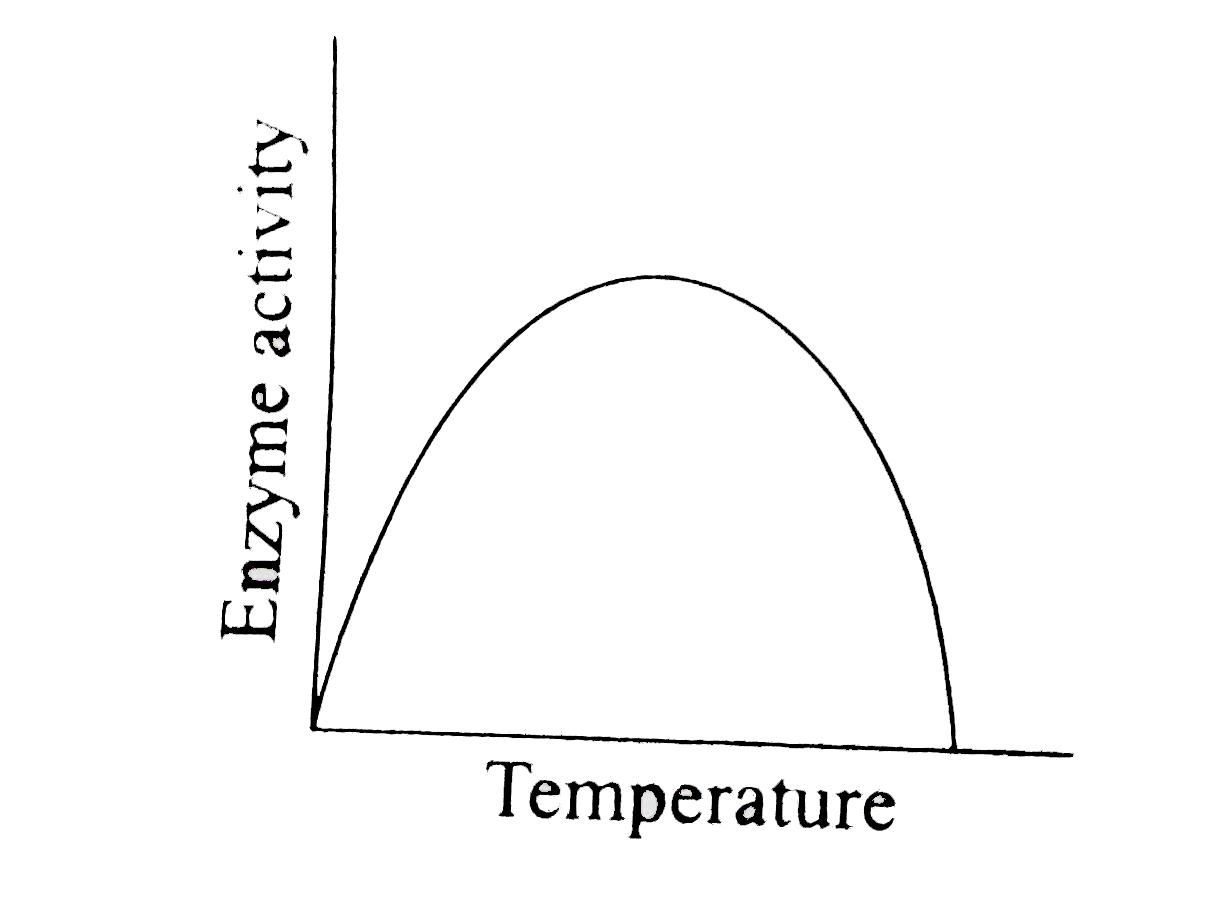
- The curve given below show enzymatic activity with relation to three c...
Text Solution
|
- Major function of mineral magnesium is
Text Solution
|
- Steroids are
Text Solution
|
- Which of the following sugars cannot split into further groups by hyd...
Text Solution
|
- Apoenzyme is
Text Solution
|
- In a 100 g living tissue, the amount of water would be
Text Solution
|
- Which is present in very little quantity in the body ?
Text Solution
|
- Cellulose is a homopolymer of
Text Solution
|
- Macromolecule chitin is
Text Solution
|
- Which is true about enzymes ?
Text Solution
|
- Given below is the diagrammatic representation of one of the categorie...
Text Solution
|
- Which one is the most abundant protein in the animal world
Text Solution
|
- Which one out of A-D given below correctly represents the structural f...
Text Solution
|
- Which one of the following is not true for enzymes
Text Solution
|
- Identify the polysaccharide with beta-glycosidic bonds
Text Solution
|
- Storage protein that coagulated on heating nut remains soluble in dilu...
Text Solution
|
- Insulin is a/an
Text Solution
|
- Higher animals cannot synthesize few fatty acids which are very essent...
Text Solution
|