A
B
C
D
Text Solution
Verified by Experts
The correct Answer is:


Topper's Solved these Questions
BIOMOLECULES
A2Z|Exercise Section -c Previous Years Examination Questions (assertion And Reason Type Questions)|8 VideosBIOMOLECULES
A2Z|Exercise Section D: Chapter End Test|50 VideosBIOMOLECULES
A2Z|Exercise Section -c Previous Years Examination Questions (neet/aipmt Questions)|116 VideosBIOLOGICAL CLASSIFICATION
A2Z|Exercise Mock Test Assertion - Reasoning Question|5 VideosBODY FLUIDS AND CIRCULATION
A2Z|Exercise Section D: Chapter-end Test|50 Videos
Similar Questions
Explore conceptually related problems
A2Z-BIOMOLECULES-Section -c Previous Years Examination Questions (aiims Question)
- The vitamin nicotinamide can be synthesized in our body from
Text Solution
|
- Protein are
Text Solution
|
- Which of the following gives Fehling's test ?
Text Solution
|
- An example of competitive inhibition of an enzyme is the inhibition of
Text Solution
|
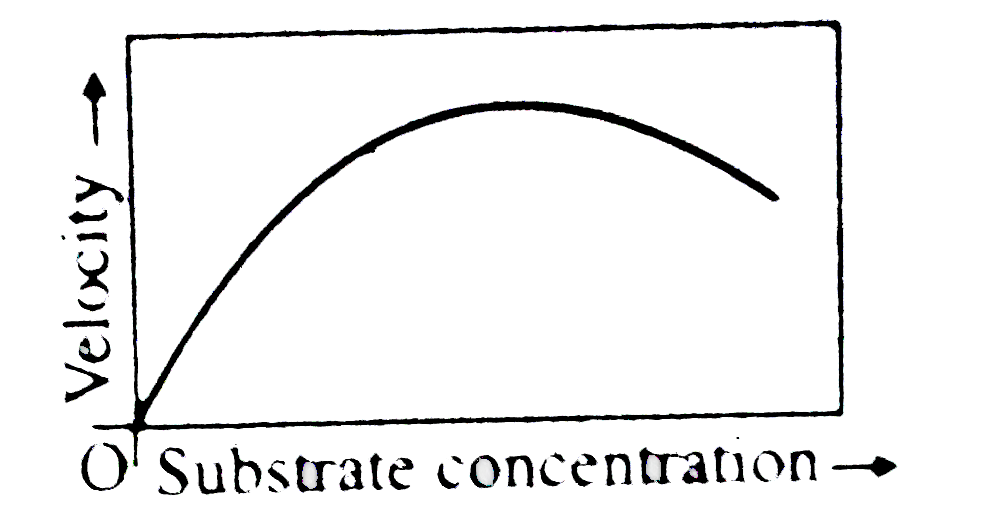
- The given graph shows the effect of substrate concentration on the ra...
Text Solution
|
- In which one of the following sets of three items each belong to the c...
Text Solution
|
- Figure given below shows three velocity-substrate concentration curv...
Text Solution
|
- Which of the following contain beta-1,4 linkage ?
Text Solution
|
- Which statement is true?
Text Solution
|
- Michaelis constant K(m) is equla to
Text Solution
|
- Alpha-keratin is a protein, present in
Text Solution
|
- Essential oils are those which
Text Solution
|
- The diagram illustrates energy changes in an enzyme controlled reactio...
Text Solution
|
- K(m) value of enzyme is substrate concentration at
Text Solution
|
- Which enzyme helps in transfer of phosphate group from ATP to a carboh...
Text Solution
|
- Match the column I and with Column II and select the correct option fr...
Text Solution
|
- Cholesterol is a precursor for each of the following except
Text Solution
|
- Which one of the following is an incorrect combinations ?
Text Solution
|
- Match the following :
Text Solution
|
- Glycoprotein contains
Text Solution
|