A
B
C
D
Text Solution
Verified by Experts
The correct Answer is:


Topper's Solved these Questions
BODY FLUIDS AND CIRCULATION
A2Z|Exercise SECTION C: PREVIOUS YEARS' EXAMINATION QUESTIONS (AIIMS QUESTIONS )|17 VideosBODY FLUIDS AND CIRCULATION
A2Z|Exercise SECTION C: PREVIOUS YEARS' EXAMINATION QUESTIONS (ASSERTION AND REASON TYPE QUESTIONS )|6 VideosBODY FLUIDS AND CIRCULATION
A2Z|Exercise Section B: Assertion-reasoning Questions|12 VideosBIOMOLECULES
A2Z|Exercise Section D: Chapter End Test|50 VideosBREATHING AND EXCHANGE OF GASES
A2Z|Exercise Section D: Chapter-end Test|50 Videos
Similar Questions
Explore conceptually related problems
A2Z-BODY FLUIDS AND CIRCULATION -SECTION C: PREVIOUS YEARS' EXAMINATION QUESTIONS (NEET/AIPMT Questions )
- Which one of the following proteinsin involved in the coagulation of b...
Text Solution
|
- Arteries are best defined as the vessels which
Text Solution
|
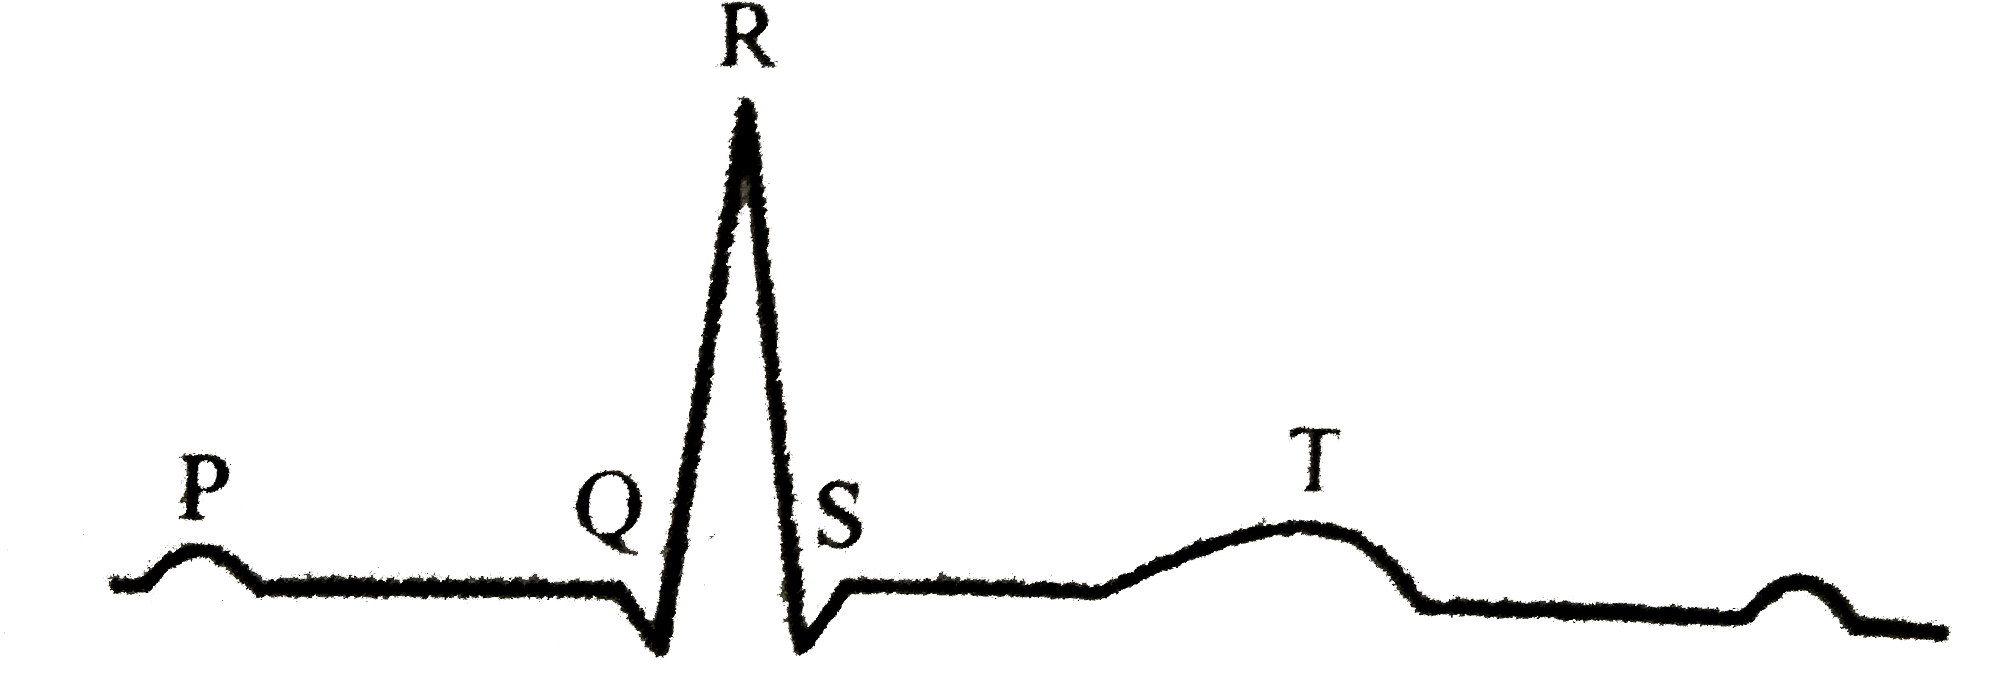
- The given figure is the ECG of a normal human. Which one of its compon...
Text Solution
|
- A vein starts from capillaries and ends in capillaries
Text Solution
|
- Universal donor blood group is
Text Solution
|
- Cardiac output is
Text Solution
|
- Which one regulates heart beat?
Text Solution
|
- Purkinjr fibres are present in
Text Solution
|
- In ECG, P-wave refers to
Text Solution
|
- Erythroblastosis foetalis occurs:
Text Solution
|
- In human beings, duration of cardiac cycle is
Text Solution
|
- Compared to those of humans, erythrocytes of Frog are
Text Solution
|
- The blood vessel which supplies oxygenated blood to cardiac tissue is
Text Solution
|
- Circulatory system does not help in
Text Solution
|
- Lub sound produced by heart is caused by
Text Solution
|
- Number of action potentials that can be generated by sino-atrial node ...
Text Solution
|
- If blood pressure reads 140 systole and 90 diastole, the condition is ...
Text Solution
|
- Choose the correct option. (i) Human heart is ectodermal in origin. ...
Text Solution
|
- Choose the correct statement.
Text Solution
|
- From which part of heart does the largest artery arise
Text Solution
|