


Topper's Solved these Questions
Similar Questions
Explore conceptually related problems
CPC CAMBRIDGE PUBLICATION-STATISTICS-Exercise 13.4
- The following distribution gives the daily income of 50 workers of a f...
Text Solution
|
- During the medical check-up of 35 students of a class, their weights w...
Text Solution
|
- Difference between two consecutive upper class limits = 2 . From this...
Text Solution
|
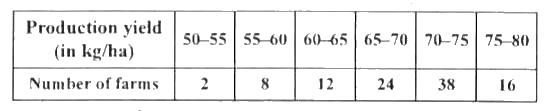
- The following table gives production yield per hectare of wheat of 100...
Text Solution
|