


Similar Questions
Explore conceptually related problems
Recommended Questions
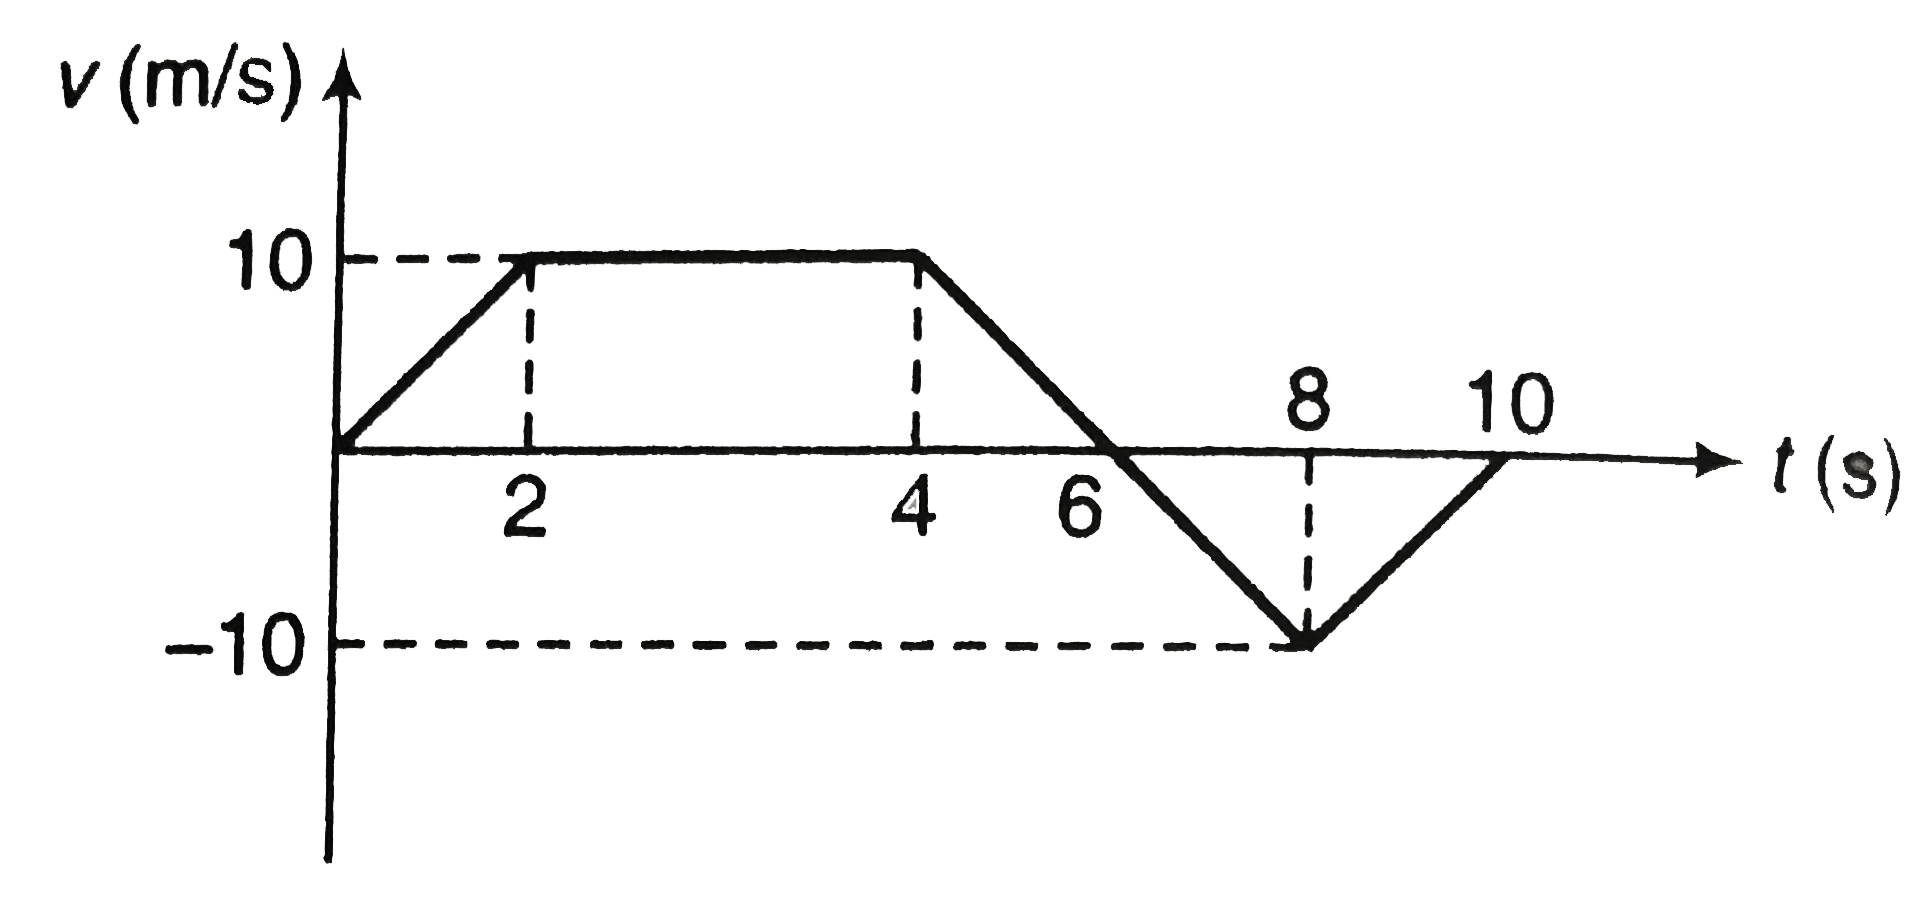
- Velocity-time graph of a particle moving in a straight line is shown i...
Text Solution
|
- Velocity of a particle moving in a straight line varies with its displ...
Text Solution
|
- Velocity-time graph of a particle moving in a straight line is shown i...
Text Solution
|
- Acceleration-time graph of a particle moving in a straight line is as ...
Text Solution
|
- Velocity-time graph of a particle moving in a straight line is shown i...
Text Solution
|
- Velocity-time graph of a particle moving in a straight line is shown i...
Text Solution
|
- Velocity-time graph of a particle moving in a straight line is shown i...
Text Solution
|
- The acceleration of particle varies with time as shown. (a) Find an...
Text Solution
|
- For a particle moving in a straight line, the position-time graph is a...
Text Solution
|