Text Solution
Verified by Experts


Topper's Solved these Questions
ORGANISATION OF DATA
TARUN JAIN & VK OHRI|Exercise EXERCISE M.C.Q|10 VideosORGANISATION OF DATA
TARUN JAIN & VK OHRI|Exercise EXERCISE FILL IN THE BLANK|7 VideosORGANISATION OF DATA
TARUN JAIN & VK OHRI|Exercise EXERCISE NCERT|13 VideosMEASURES OF DISPERSION
TARUN JAIN & VK OHRI|Exercise Learning by doing|30 VideosPRESENTATION OF DATA - TEXTUAL AND TABULAR PRESENTATION
TARUN JAIN & VK OHRI|Exercise ESSENTIAL PRATICALS|8 Videos
Similar Questions
Explore conceptually related problems
TARUN JAIN & VK OHRI-ORGANISATION OF DATA-Miscellaneous Illustration
- In a survey, it was found that 50 families bought milk in the followin...
Text Solution
|
- Prepare a frequency series of the ages of 25 students of Class XI in y...
Text Solution
|
- We have the following data on the monthly expenditure on food (in rupe...
Text Solution
|
- Make a frequency distribution (inclusive ) series of the following dat...
Text Solution
|
- Convert the following cumulative frequency distribution into a simple ...
Text Solution
|
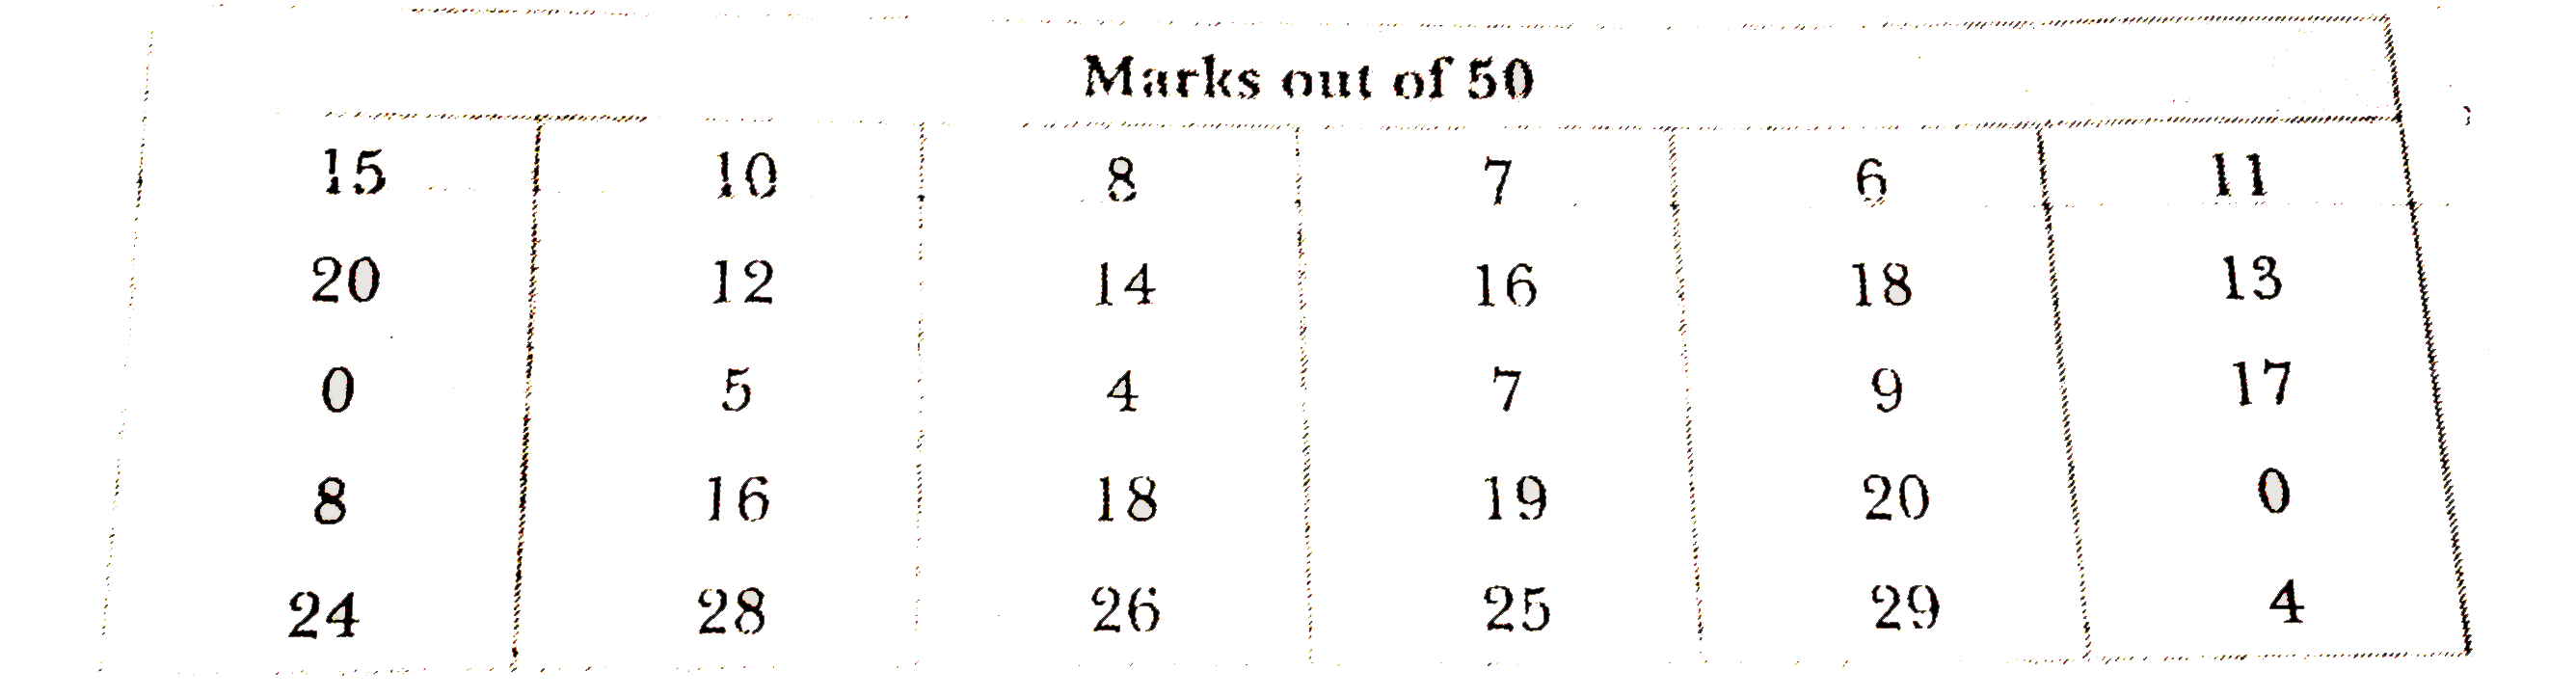
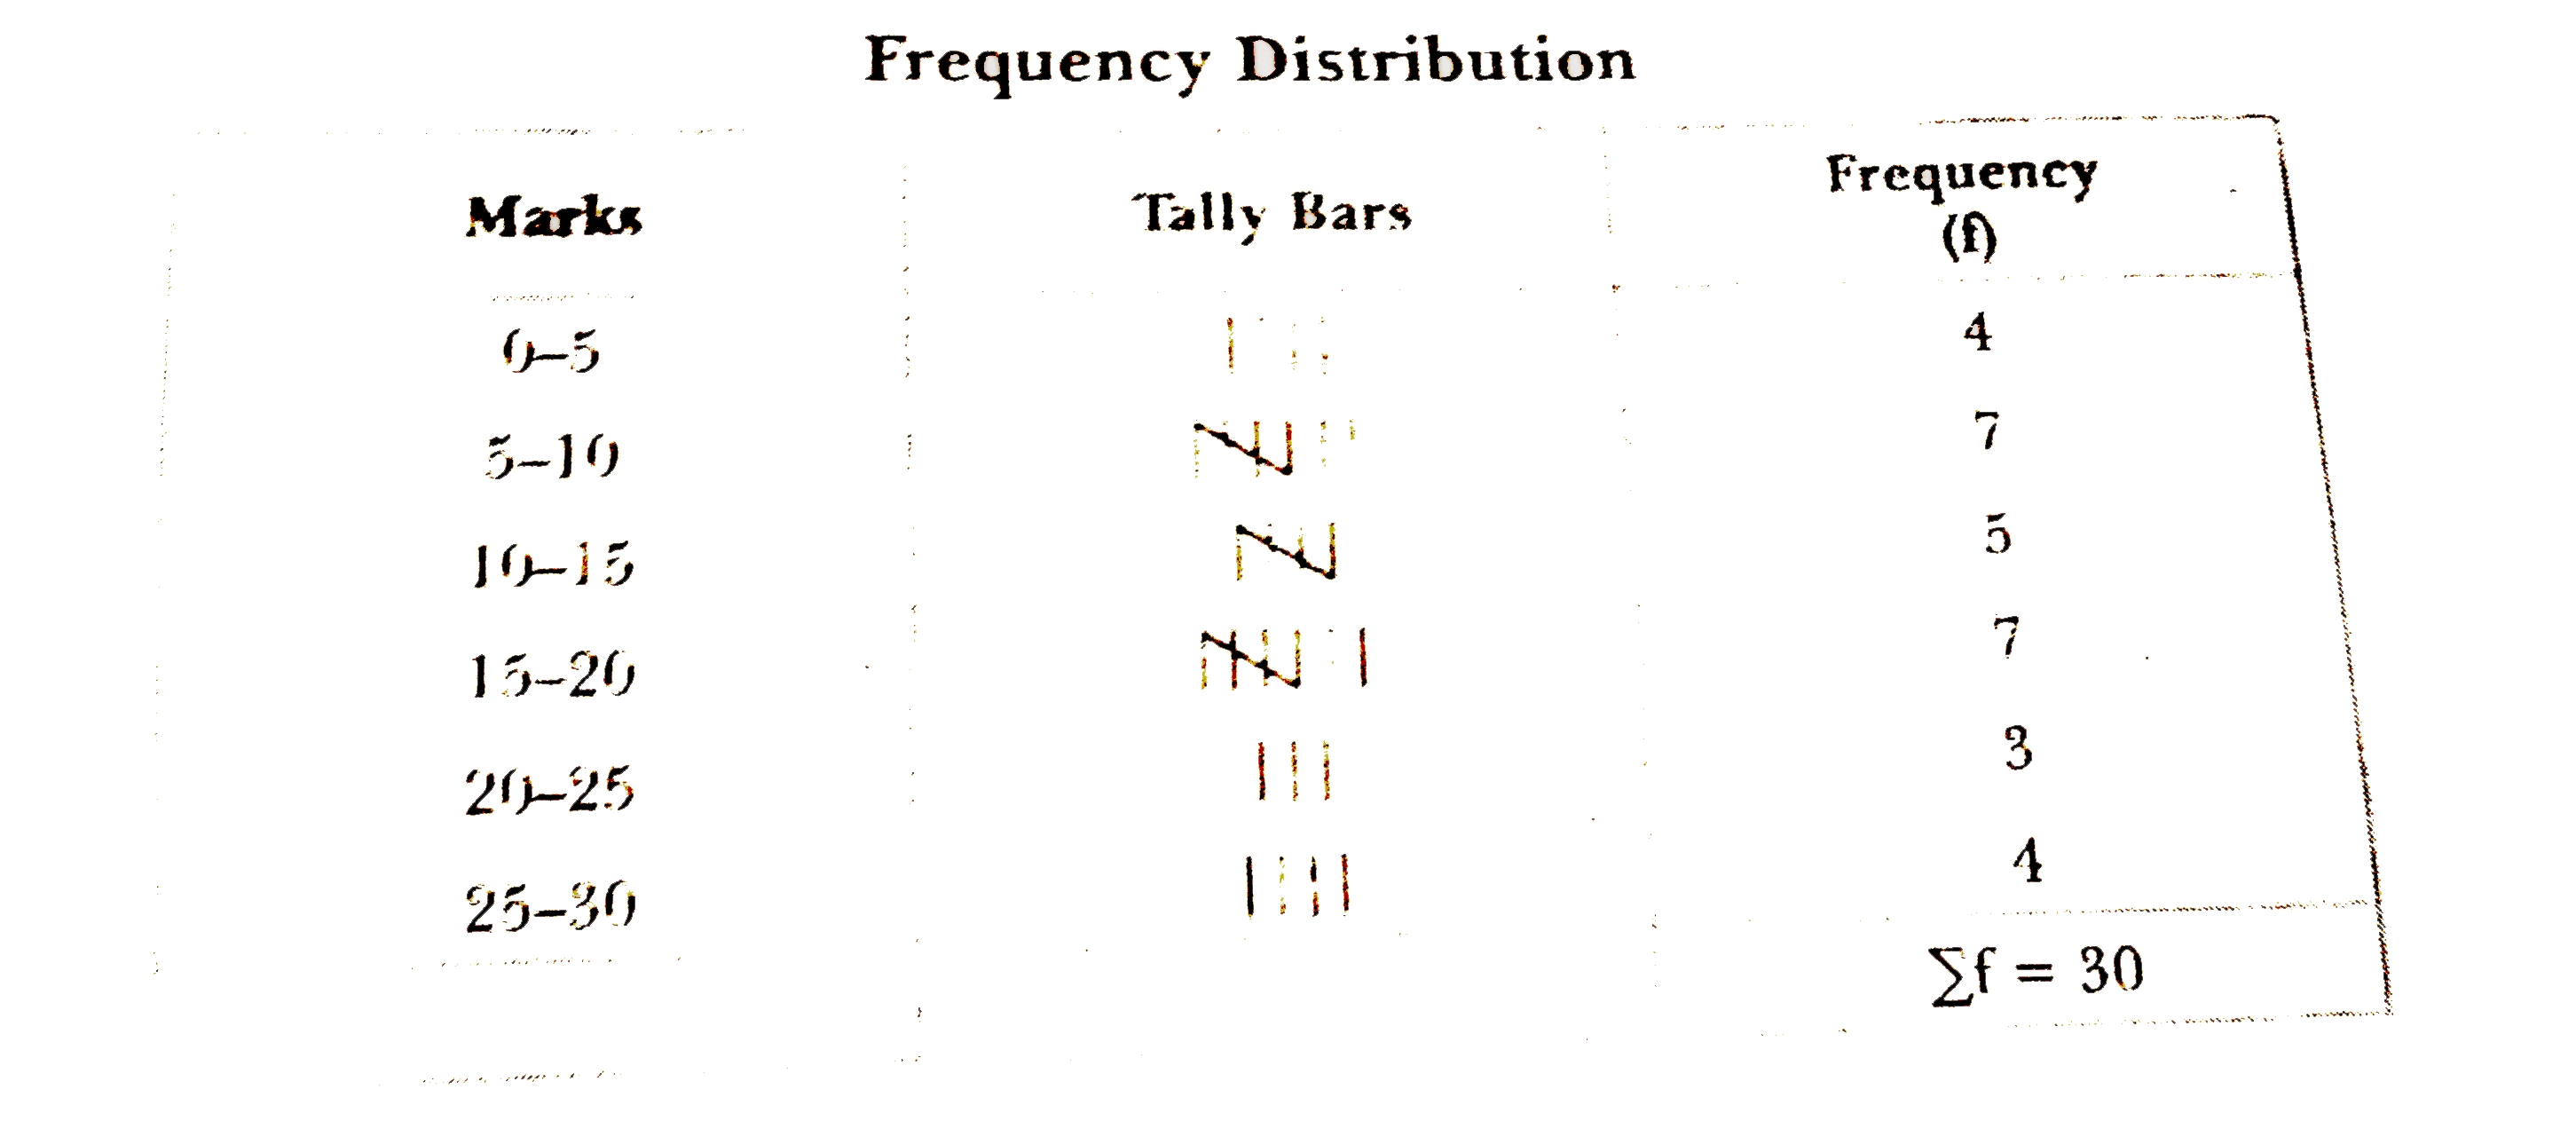
- The following are the marks obtained by 30 students of Class XI in Sta...
Text Solution
|
- Convert the following inclusive series into exclusive series :
Text Solution
|
- The monthly salary of some families in a society is given below : ...
Text Solution
|
- Convert the following cumulative frequency distribution into a simple ...
Text Solution
|
- Following are the marks obtained by 25 students in Statistics . Prepar...
Text Solution
|
- For the following raw data prepare a frequency distribution with a cla...
Text Solution
|
- Convert the following series into a simple frequency distribution :
Text Solution
|
- Convert the following series into a simple frequency distribution :
Text Solution
|