


Topper's Solved these Questions
ORGANISATION OF DATA
TARUN JAIN & VK OHRI|Exercise EXERCISE NCERT|13 VideosORGANISATION OF DATA
TARUN JAIN & VK OHRI|Exercise EXERCISE LONG ANSWER|7 VideosMEASURES OF DISPERSION
TARUN JAIN & VK OHRI|Exercise Learning by doing|30 VideosPRESENTATION OF DATA - TEXTUAL AND TABULAR PRESENTATION
TARUN JAIN & VK OHRI|Exercise ESSENTIAL PRATICALS|8 Videos
Similar Questions
Explore conceptually related problems
TARUN JAIN & VK OHRI-ORGANISATION OF DATA-EXERCISE ESSENTIAL PRACTICALS
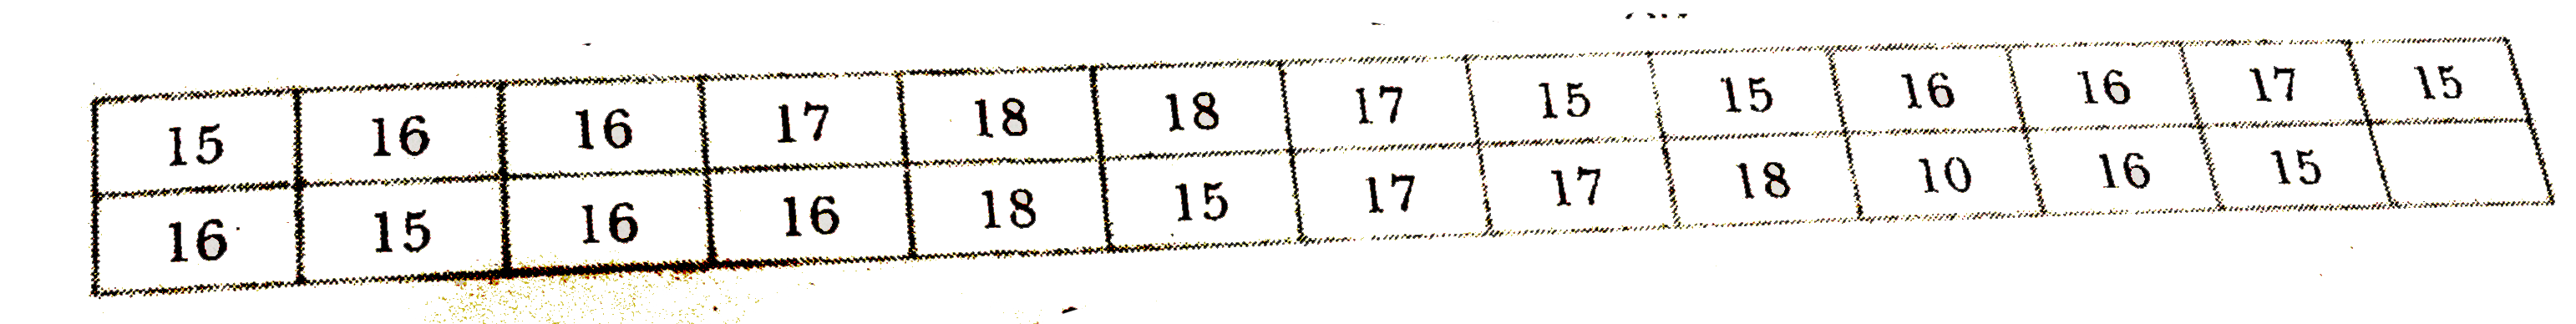
- The following data is of the age of 25 students of Class XI : Arr...
Text Solution
|
- Weight of 20 students is given in kilograms. Using class interval of 5...
Text Solution
|
- In the following statement, take the number of letters in a word as it...
Text Solution
|
- An economic survey revealed that 30 families in a town incur following...
Text Solution
|